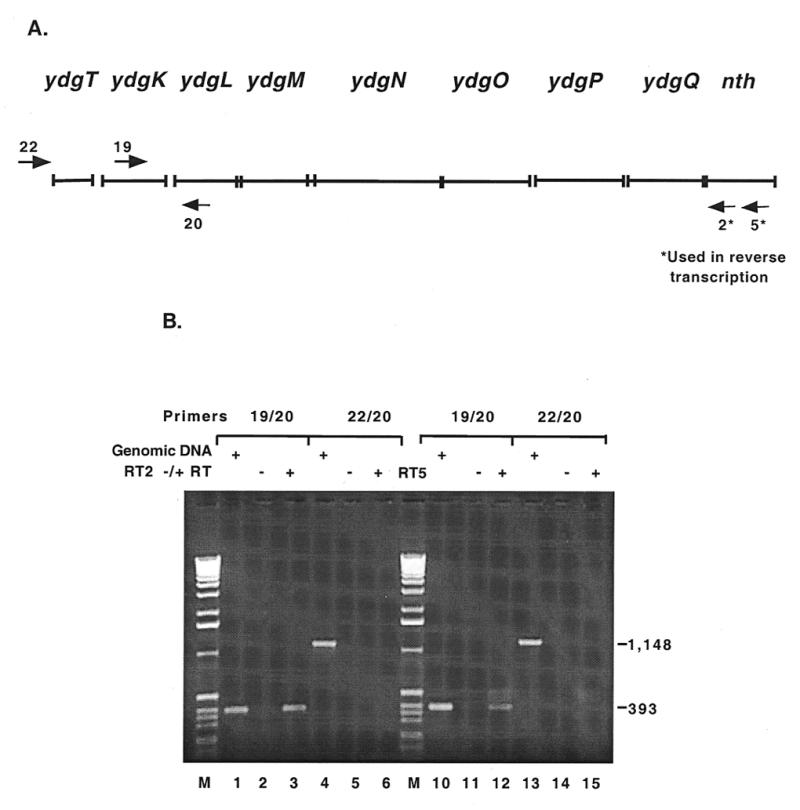
Figure 4.

Mapping of the nth transcript by RT–PCR. (A) The arrows numbered 20, 19 and 22 represent the primers used in PCR. The arrows numbered 2* and 5* represent the primers used to reverse transcribe E.coli total RNA. Primer nth20 anneals 88 bp 3′ to the predicted ydgL start codon, nei19 anneals 236 bp 3′ to the predicted ydgK start codon and nei22 anneals 242 bp 5′ to the predicted ydgT start codon. (B) Lanes 1, 4, 10 and 13 are positive controls with E.coli genomic DNA as the PCR template. Lanes 2 and 5 are negative controls with RT reaction mixtures minus reverse transcriptase with primer 2* as the PCR template. Lanes 11 and 14 are the negative controls for primer 5*. Lanes 3 and 6 show PCR results with the cDNA from reverse transcription with primer 2* (RT2) as template. Lanes 12 and 15 show PCR results obtained with the cDNA from RT with primer 5* (RT5) as the template.
