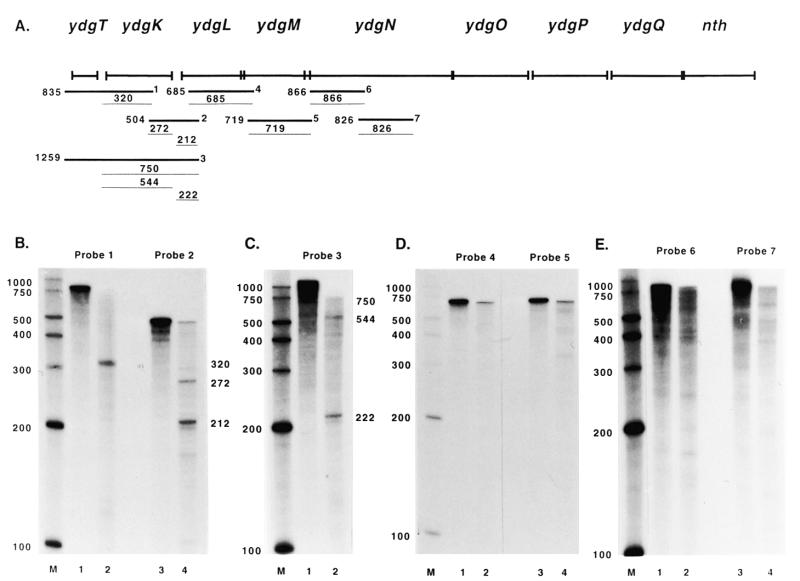
Figure 5.
Mapping of the nth transcript by RPAs. (A) The thick lines designated 1–7 indicate the approximate annealing locations of the probes used in the RPAs. The thin lines indicate the products obtained from RPAs with these probes along with the sizes of the products. The sizes and exact annealing locations of the probes are as follows: probe 1, 835 nt, anneals from 316 bp 3′ to the ydgK start codon to 519 bp 5′ to the ydgK start codon; probe 2, 504 nt, anneals from 199 bp 3′ to the ydgL start codon to 305 bp 5′ to the ydgK start codon; probe 3, 1259 nt, anneals from 199 bp 3′ to the ydgL start codon to 519 bp 5′ to the ydgK start codon; probe 4, 685 nt, anneals from 113 bp 3′ to the ydgM start codon to 10 bp 3′ to the ydgL start codon; probe 5, 719 nt, anneals from 150 bp 3′ to the ydgN start codon to 3 bp 3′ to the ydgM start codon; probe 6, 866 nt, anneals from 907 bp 3′ to the ydgN start codon to 42 bp 3′ to the ydgN start codon; probe 7, 826 nt, anneals from 1687 bp 3′ to the ydgN start codon to 862 bp 3′ to the ydgN start codon. (B–E) Lanes 1 and 3 in (B), (D) and (E) and lane 1 in (C) show the full-length probe. Lanes 2 and 4 in (B), (D) and (E) and lane 2 in (C) show RPA results.

