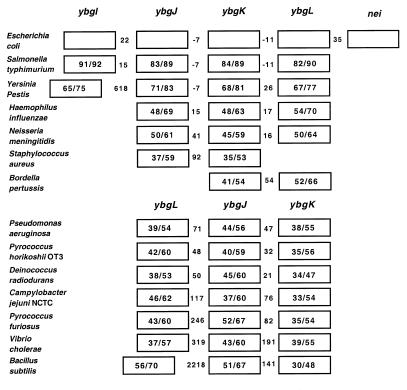
Figure 8.
Conservation of gene arrangement for the nei operon. The numbers in the boxes are percent identity/percent similarity of the proteins relative to the E.coli proteins. The numbers between the boxes represent the number of base pairs in the intergenic regions; negative numbers indicate that the ORFs overlap.

