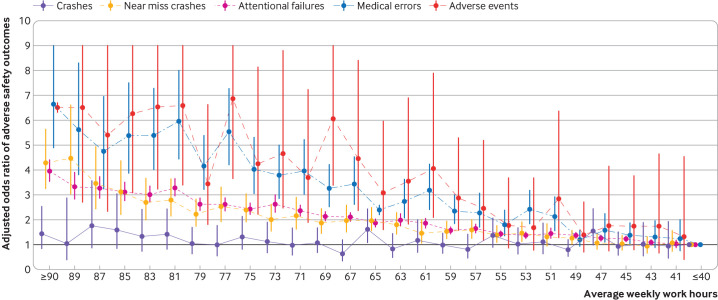
Figure 2.
Continuous analysis of adverse safety outcomes among study participants. All models are adjusted for age, gender, specialty, and cohort; medical errors and adverse events are further adjusted for hours in patient care. Estimates for near miss crashes and attentional failures are incidence rate ratios (95% confidence intervals); all other estimates are odds ratios (95% confidence intervals). Crashes=motor vehicle crashes. Referent group is ≤40 hours/week. An odds ratio of 1 is indicated by a horizontal black line; estimates crossing 1 do not differ significantly from the referent group (≤40 hours/week)

