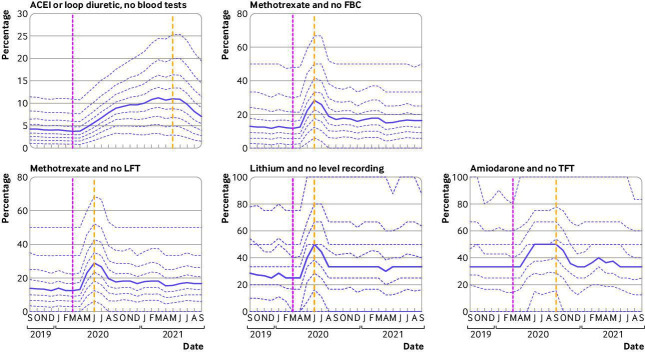
Figure 2.
Practice level decile plots for PINCER blood test monitoring indicators. The percentage of patients identified as at risk of potentially hazardous prescribing as measured by each indicator is reported for the period September 2019 to September 2021 (inclusive). The median percentage is displayed as a thick purple line and deciles are indicated by dashed purple lines. The month of national lockdown in England as a response to the onset of covid-19 (March 2020) is highlighted with a pink dashed vertical line. The project date of maximum impact, as measured from the onset of covid-19, for each indicator is shown by a yellow dashed vertical line. All deciles are calculated across 6367 practices (2546 OpenSAFELY-TPP plus 3821 OpenSAFELY-EMIS practices). Decile plots for these same indicators, in OpenSAFELY-TPP and OpenSAFELY-EMIS separately, are available in online supplemental figures 3 and 4 respectively. ACEI=angiotensin-converting enzyme inhibitors; FBC=full blood count; LFT=liver function test; TFT=thyroid function test

