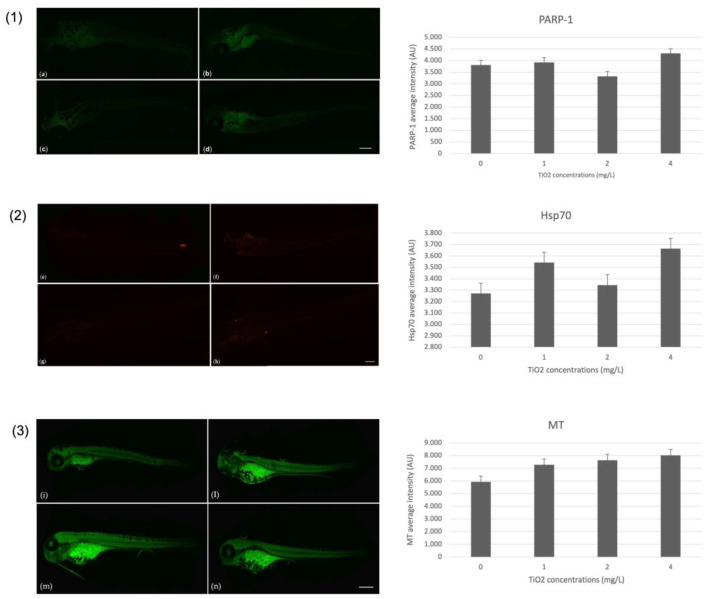
Figure 4.
In order (1) PARP-1 antibody-staining, (2) Hsp70 antibody-staining, and (3) MT antibody-staining. (a,e,i) larva unexposed to TiO2-NPs; (b,f,l) larva exposed to 1 mg/L TiO2-NPs; (c,g,m) larva exposed to 2 mg/L TiO2-NPs; and (d,h,n) larva exposed to 4 mg/L TiO2-NPs. The histogram next to each photo represents the average fluorescence intensity (AU) of the corresponding biomarker. Scale bar 420 µm.

