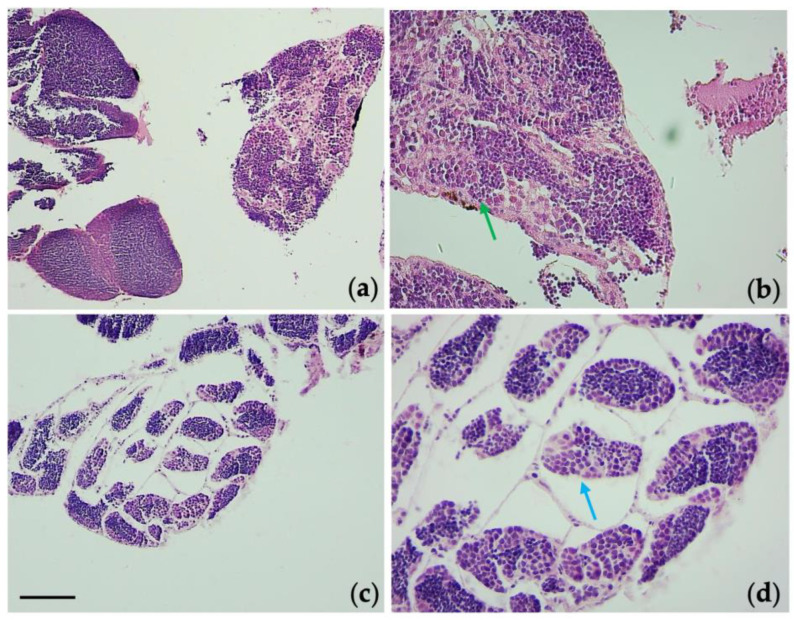
Figure 7.
Histological sections of the testis. Unexposed group: 10× (a), and 40× (b). Group of 2mg/L TiO2-NPs: (c) 10×, and (d) 40×. E-E staining, sections 4 µm. Blue arrow indicate the detachment of the spermatogenic epithelium from the connective tissue in the exposed group (2mg/L), while in the control group the spermatogenic epithelium maintains its contact with connective tissue (green arrow). Scale bar 260 µm.

