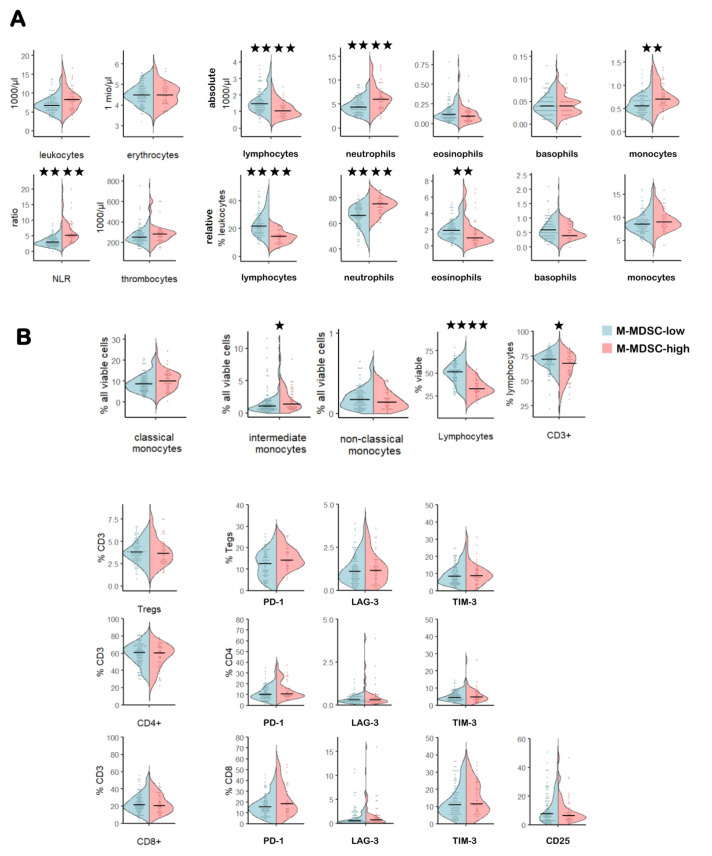
Figure 2.
Comparison of the peripheral immune signature in M-MDSC-high versus M-MDSC-low patients. Violin plots depicting blood counts from the hemogram (A) and flow cytometry-derived frequencies of myeloid cells, T cells and their checkpoint receptor expression (B). *P<0.05, **p<0.01, ***p<0.005, ****p<0.0001. LAG-3, lymphocyte activation gene 3; M-MDSC, monocytic myeloid-derived suppressor cell; NLR, neutrophil-to-lymphocyte ratio; PD-1, programmed cell death protein 1; TIM-3, T cell immunoglobulin and mucin-domain containing-3; Treg, regulatory T cell.

