Figure 2.

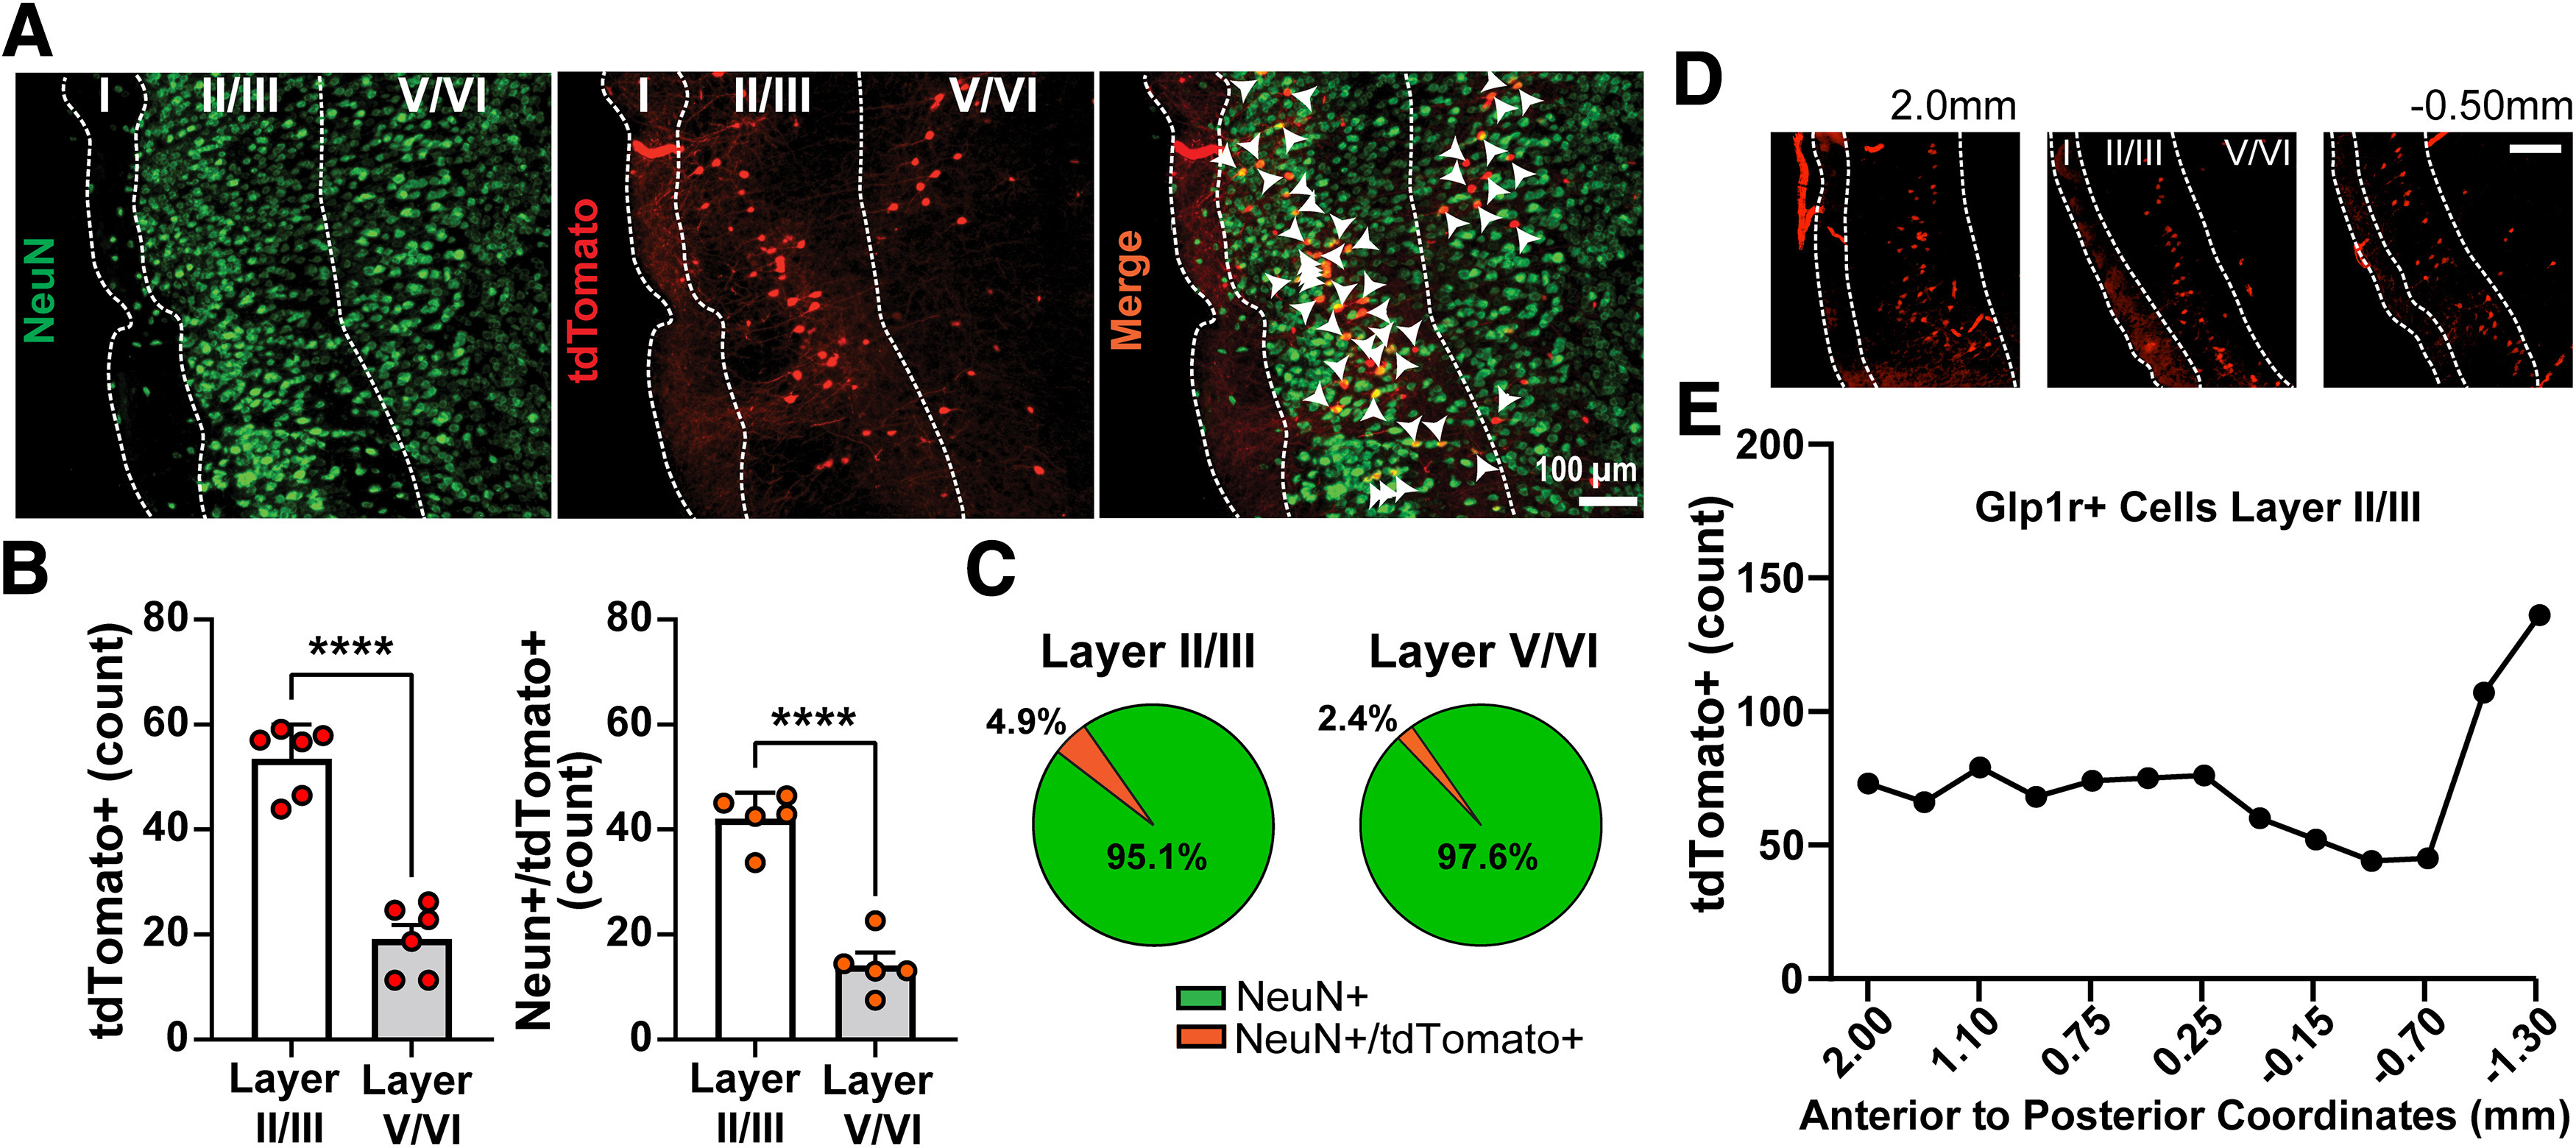
GLP-1Rs are neuronally expressed within the GC. A, Representative image of the GC from a Glp1r-Cre;Ai9 mouse immunolabeled for the neuronal marker NeuN and a merged image showing tdTomato+ somatic colocalization with NeuN (white arrowheads). B, Quantification of tdTomato+ neurons and NeuN+/tdTomato+ neurons in the GC; ****p < 0.0001 layer II/III versus V/VI. C, Pie charts depicting percentage of NeuN-expressing and NeuN+/tdTomato+-coexpressing cells within layers II/III and V/VI. Data in B are mean + SEM. Data in B and C are from n = 6 mice, 5–10 sections per mouse. D, Representative images of tdTomato+-expressing cells throughout the anterior–posterior axis of the insula cortex. Coordinates are relative to bregma. Scale bar, 100 µm. E, tdTomato+ cell count throughout the anterior–posterior axis of insula cortex layer II/III from the same mouse as in D.
