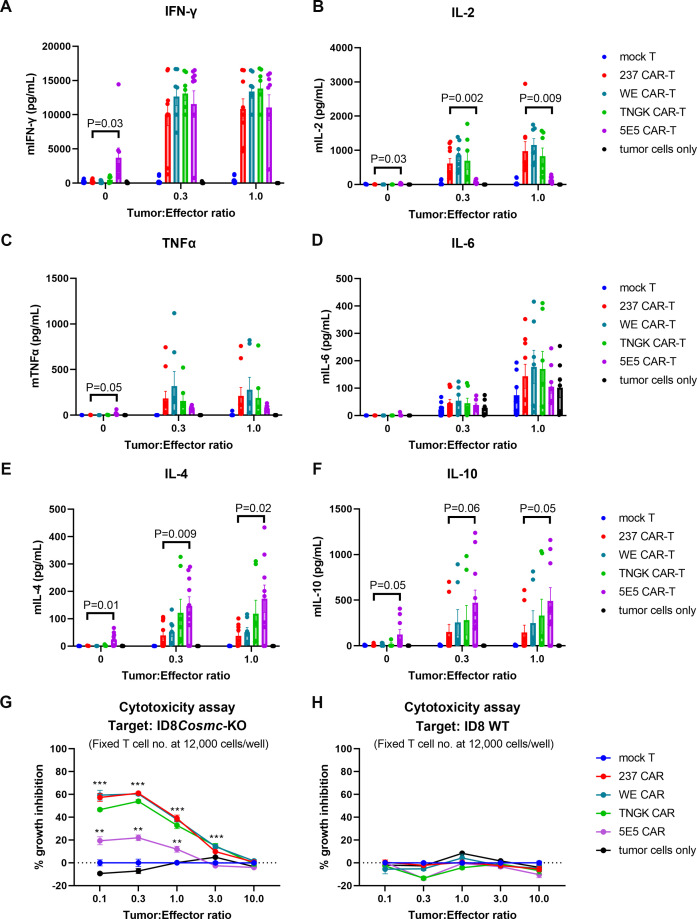
Figure 5.
In vitro cytokine and killing analyses of different CAR T cells. Mock, 237-CAR, WE-CAR, TNGK-CAR, or 5E5-CAR transduced primary T cells from C57BL/6J donor mice were co-cultured with ID8Cosmc-KO cells in a 96-well plate for 24 hours at various tumor:effector ratios. The number of effector T cells were kept constant at 12,000 cells/well across all conditions tested. After 24 hours, 25 uL culture supernatants were analyzed for multiple cytokines using a Luminex plate reader to measure IFN-γ (A), IL-2 (B), TNFα (C), IL-6 (D), IL-4 (E), and IL-10 (F). Plots shown are combined cytokine array data points from five experiments. Bar graphs were plotted using GraphPad Prism V.9.4.1. Error bars are SEM. To simplify the presentation, p values are shown only for 237 versus 5E5 CAR. A complete set of tumor:effector ratio titration plots for each of the five cytokine array experiments are shown in online supplemental figure S5. (G, H) The remaining ID8Cosmc-KO (G) or ID8 WT (H) adherent tumor cells on plates were fixed in ice-cold 10% trichloroacetic acid for the SRB viability assay. The percent growth inhibition was calculated using the formula outlined in the Methods section. SRB experiments were performed twice, each with a technical replicate of n=4. Bar graphs were plotted using GraphPad Prism V.9.4.1. Error bars are SEM. P values for 237, WE, TNGK were calculated against either mock or 5E5 at <0.0001 (or denoted by ***); p values for 5E5 against either mock T or TNGK are at <0.001 (**). CAR, chimeric antigen receptor; IFN, interferon; IL, interleukin; KO, knock-out; TNF, tumor necrosis factor; WT, wild-type.

