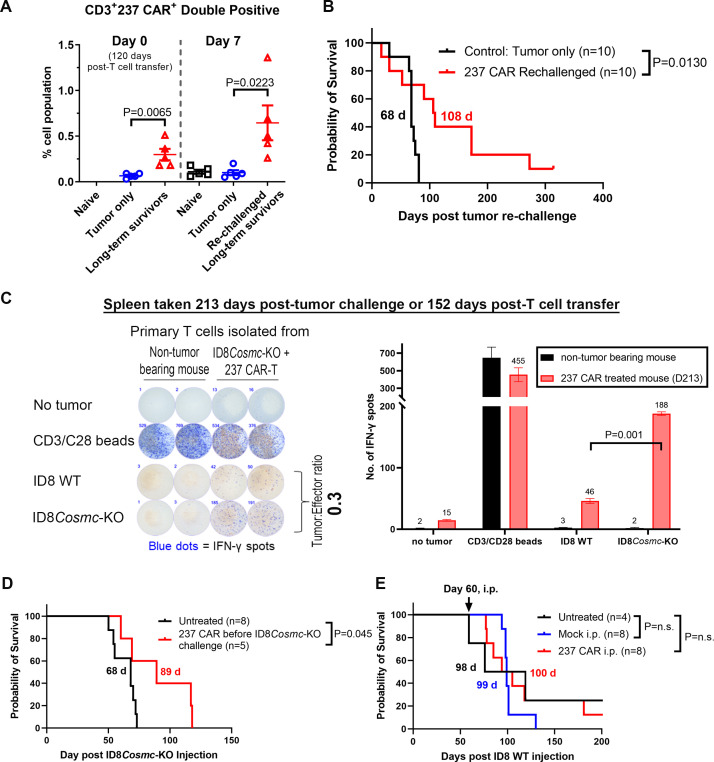
Figure 7.
Evidence for in vivo persistence of 237 CAR T cells. (A) 237 CAR T-treated ID8Cosmc-KO-bearing mice were re-challenged with 107 ID8Cosmc-KO cells at 120 days post-T cell transfer. Age-matched naïve mice were inoculated with 107 ID8Cosmc-KO cells and used as control. Blood samples were collected from some mice immediately before intraperitoneal injection of re-challenged tumors and 7 days after re-challenge; processed and stained with anti-CD3 antibody and Tn-glycosylated OTS8 peptide tetramer, and analyzed by flow cytometry. The percentage of CD3+ 237 CAR T cells were plotted using GraphPad Prism V.9.4.1. Each dot represents one mouse. Error bars are SEM. (B) Survival curve of 237 CAR T treated mice re-challenged with ID8Cosmc-KO at either 120 (n=5) or 160 days (n=5) after initial tumor injection, compared with age-matched C57BL/6 naïve mice that were inoculated with the same number of tumor cells. (C) Spleens were removed from 237 CAR T-treated ID8Cosmc-KO bearing mice up to 5 months after CAR treatment (152 days for the data shown). Spleen cells were co-cultured with either ID8 WT or ID8Cosmc-KO tumor cells in a 96-well plate at a tumor:effector ratio of 0.3. ELISpot assays were performed to measure IFN-gamma spots 24 hours after co-culture experiment. Splenocytes from age-matched mice were used as a control, while CD3/CD28 Dynabeads were added to T cells as a positive control for T cell activation. Plates were scanned with automated ImmunoSpot analyzer. Bar graph of quantified IFN-γ spots are plotted on the right panel. Results representative of five independent experiments. (D) Non-tumor bearing mice were injected intraperitoneally with 237 CAR T (see online supplemental figure S2B) or untreated. At day 60, mice were challenged with 107 ID8Cosmc-KO cells and the survival curve was compared with that of mice inoculated with tumor that did not receive prior 237 CAR T injections (untreated). (E) Survival curve of ID8 WT-bearing C57BL/6J mice either untreated (black), treated with mock-transduced T cells (blue), or treated with 237 CAR T (red), administered by intraperitoneal injection of 5×10⁶ T cells at day 60. Data for D and E are from two combined experiments. All survival curves were plotted using GraphPad Prism V.9.4.1 with the indicated total n for each treatment arm. Median survival times are indicated; p values were calculated using the log-rank (Mantel-Cox) test. CAR, chimeric antigen receptor; IFN, interferon; i.p., intraperitoneal; KO, knock-out; WT, wild-type.

