
Figure 9.
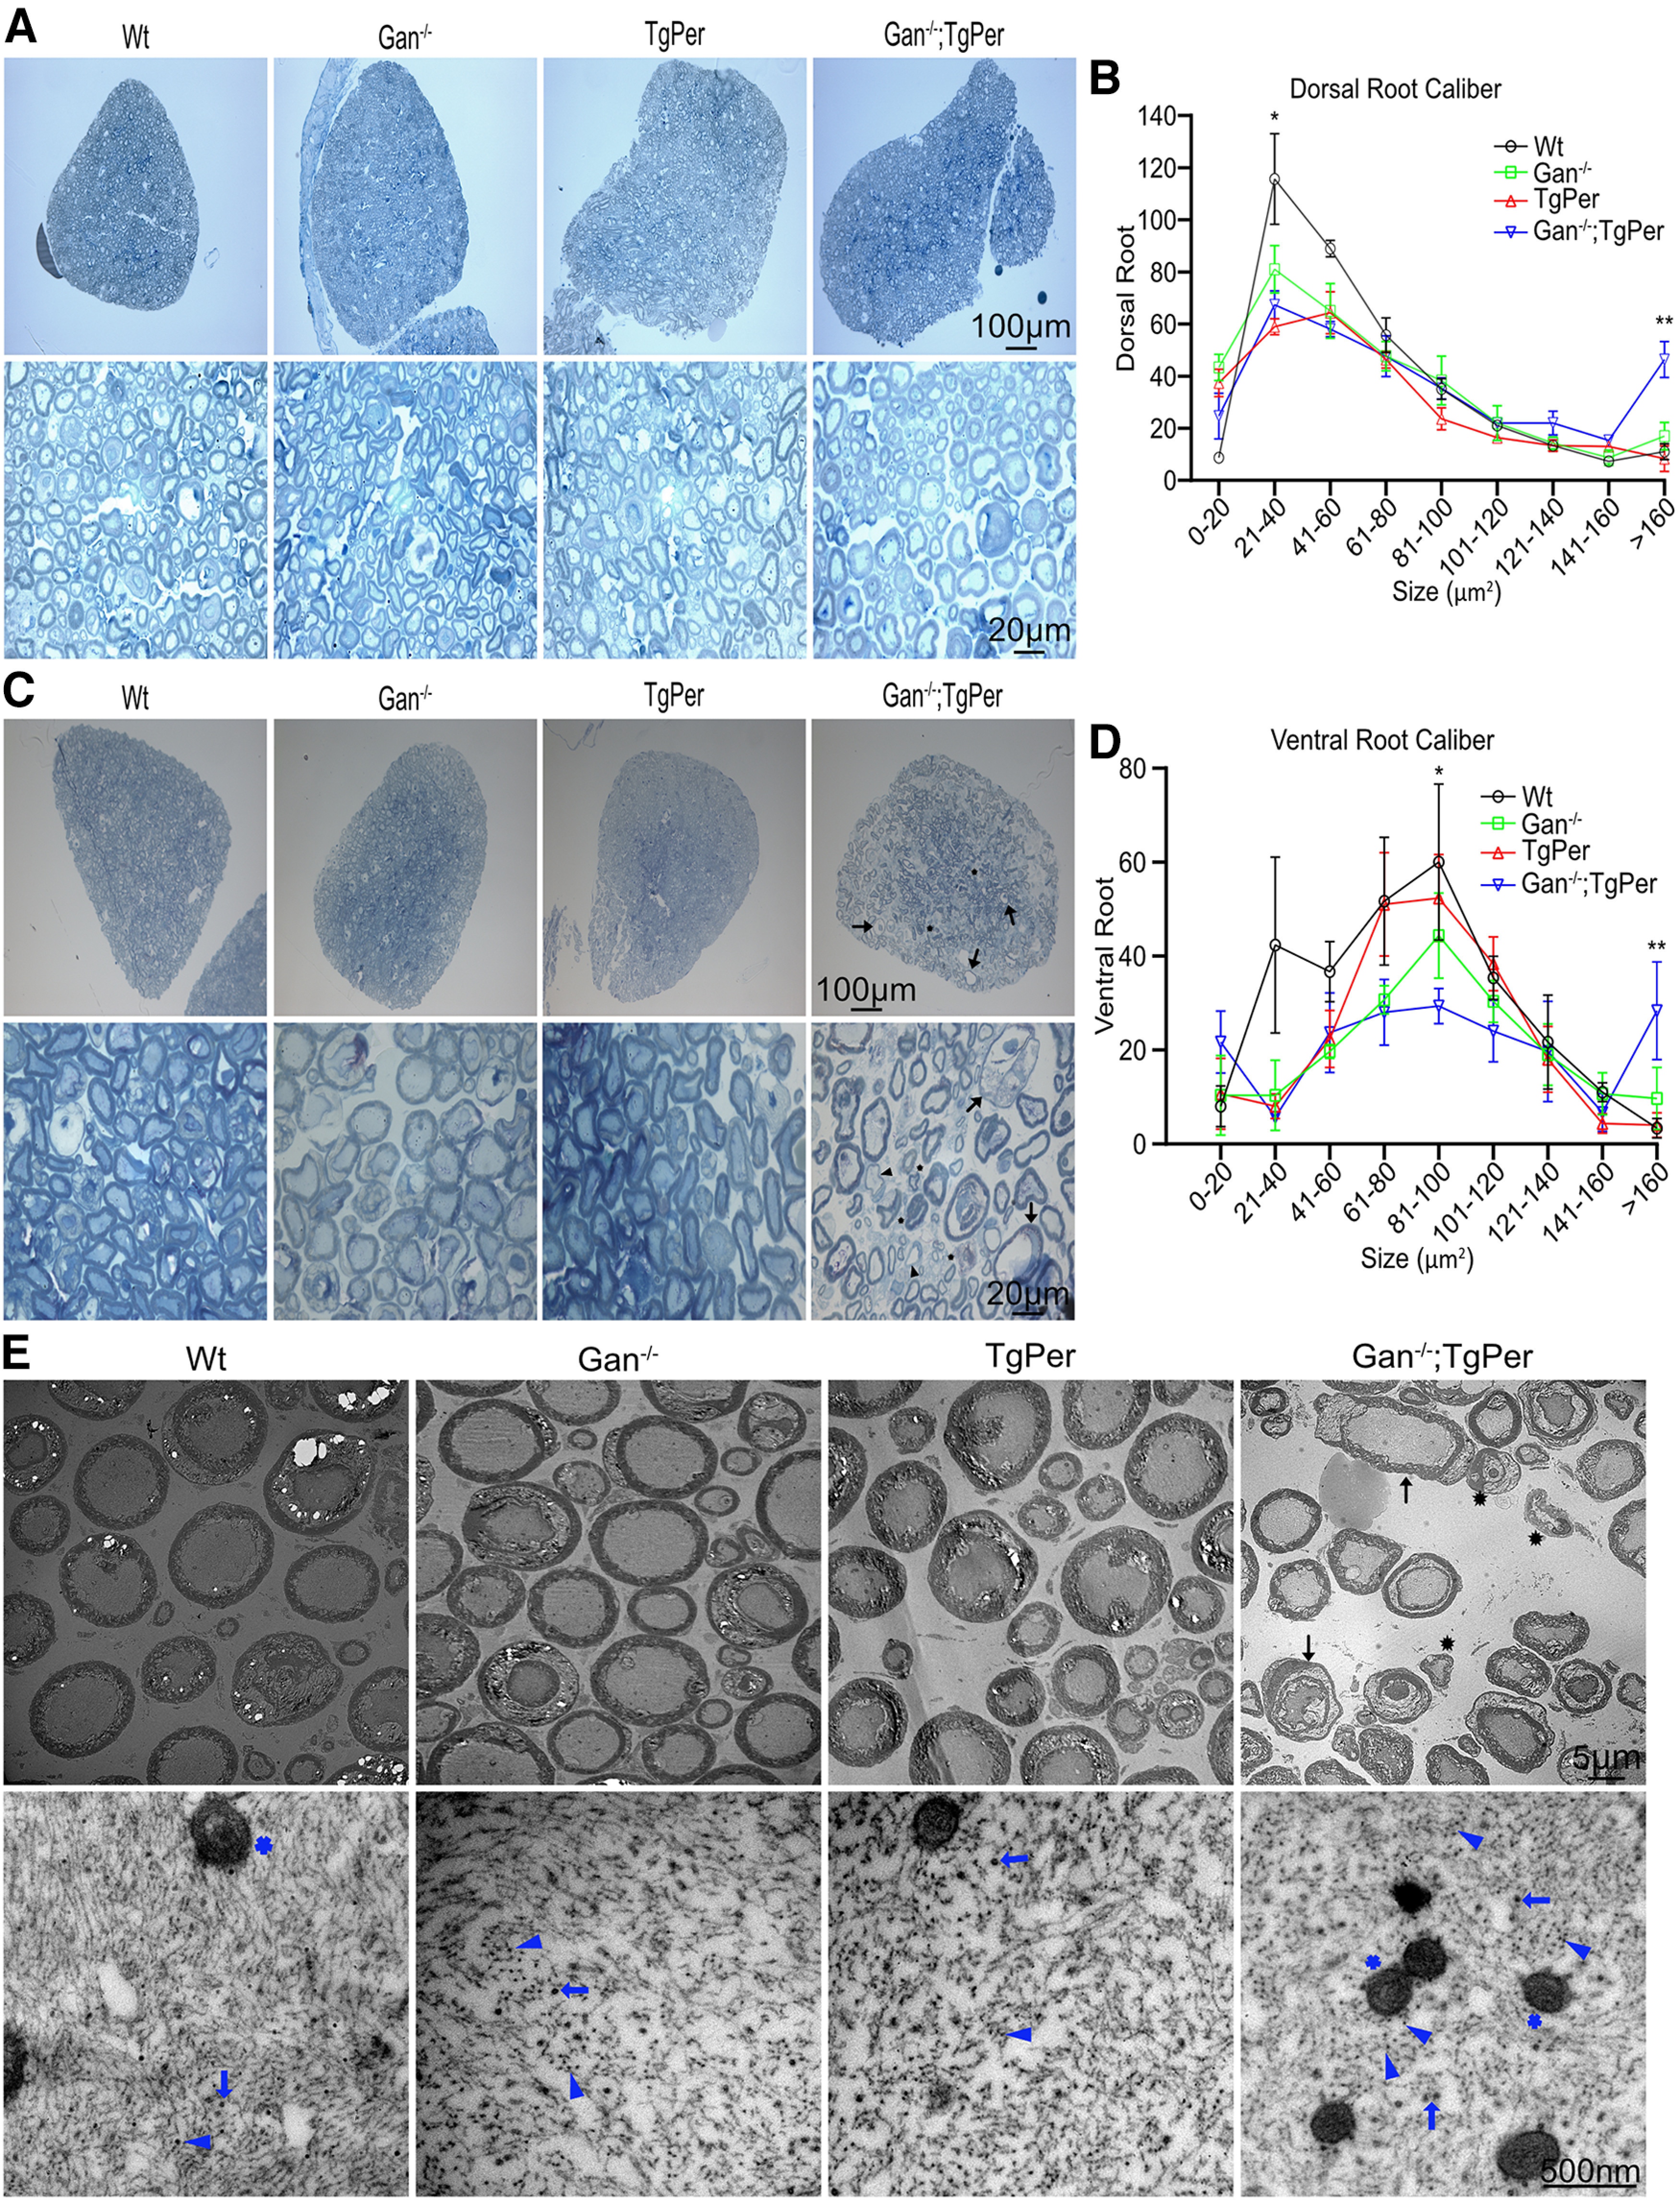
Analyses of dorsal and ventral roots, axonal degeneration and giant axons in Gan−/−;TgPer mice. A, C, The toluidine blue staining of dorsal and ventral roots. Original magnification 20× and 100×. Scale bars: 100 µm (upper images A and C) and 20 µm (lower images A and C). Three mice were considered in each group. B, D, Graphs represent quantification of dorsal and ventral axon calibers at 12 months of age, respectively. Data represent ± SEM; *p = 0.0193 (WT vs TgPer mice), *p = 0.0424 (WT vs Gan−/−;TgPer mice) in dorsal axon caliber 21–40 µm2; **p = 0.0062 (WT vs Gan−/−;TgPer mice); *p = 0.0176 (Gan−/− vs Gan−/−;TgPer mice); **p = 0.0040 (TgPer vs Gan−/−;TgPer mice) in dorsal axon caliber >160 µm2. Gan−/−;TgPer mice exhibited massive loss of axons in the ventral root (D), especially in axons with calibers between 81 and 100 µm2; *p = 0.0483 (WT vs Gan−/−;TgPer). Significant number of axons with calibers >160 µm2 were also detected in the ventral root of Gan−/−;TgPer mice; p = ** 0.0083 (WT vs Gan−/−;TgPer); *p = 0.0437 (Gan−/− vs Gan−/−;TgPer); **p = 0.0098 (TgPer vs Gan−/−;TgPer). Giant axons (arrow) along with demyelinated (arrowhead) and degenerated (asterisk) axons were found in Gan−/−;TgPer ventral root (C). E, TEM of ventral roots. Original magnification 400× and 10000×. Scale bars: 5 µm for E upper images and 500 nm for E lower images. TEM pictures show giant axons (arrows) with degenerating axons (asterisks) in ventral roots of Gan−/−;TgPer mice. Higher magnification of ventral roots revealed trapped mitochondria (blue star) surrounded by IF aggregates (blue arrowheads) and microtubules (blue arrows) in Gan−/−;TgPer mice.