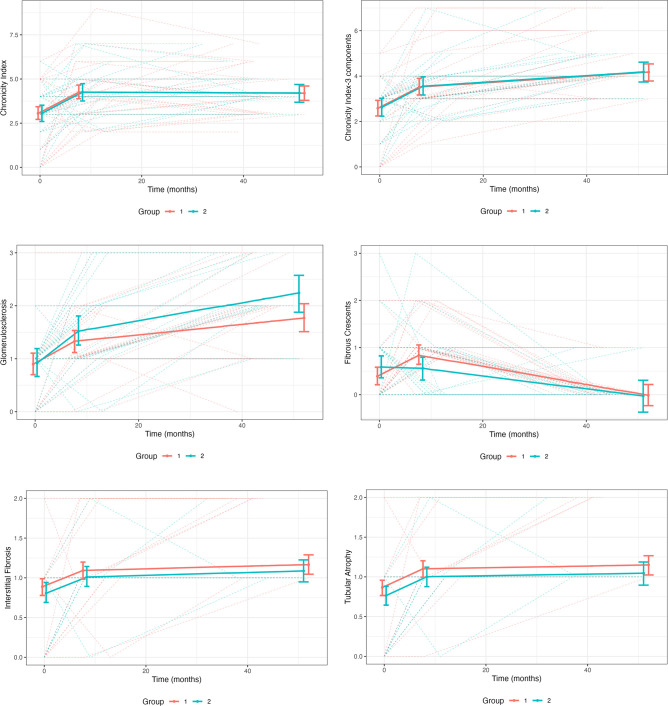
Figure 3.
The increase in chronic kidney damage during treatment. All patients analysed had three kidney biopsies. The patients were divided in those who achieved a complete histological remission by biopsy 3 (orange) and those who still had histological activity on biopsy 3 (green). The trajectory of the overall chronicity index is shown in the first graph, followed by the overall chronicity index in which the component score for fibrous crescents had been removed (Chronicity Index-3 Components). This was done because fibrous crescents are difficult to distinguish from glomerulosclerosis and appear to resolve over time, flattening the trajectory of the overall chronicity index. Time is given in months after the first (diagnostic) biopsy at time 0. The trajectories of the individual components of the chronicity index are also given. Linear splines that account for each patient at each time point are shown.

