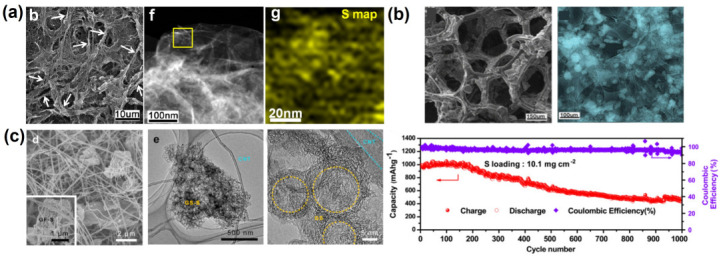
Figure 6.

(a) SEM, TEM images and the corresponding S element map of the fibrous graphene/sulfur composites [64]. Reprinted with permission from Ref. [64] (the white arrows represent the fibrous graphene, and the yellow square indicates the sulfur map region of the samples). Copyright 2013 American Chemical Society. (b) The SEM and element map images of the self-supported graphene foam electrode (top), as well as their cycling performances of the corresponding LSB with high S loading density. [65]. Reprinted with permission from Ref. [65]. Copyright 2014 Elsevier Ltd. (c) SEM and TEM images of the carbon nanotube-supported hollow graphene spheres [66]. Reprinted with permission from Ref. [66]. Copyright 2014 Elsevier Ltd (the yellow circles represent the hollow graphene spheres).
