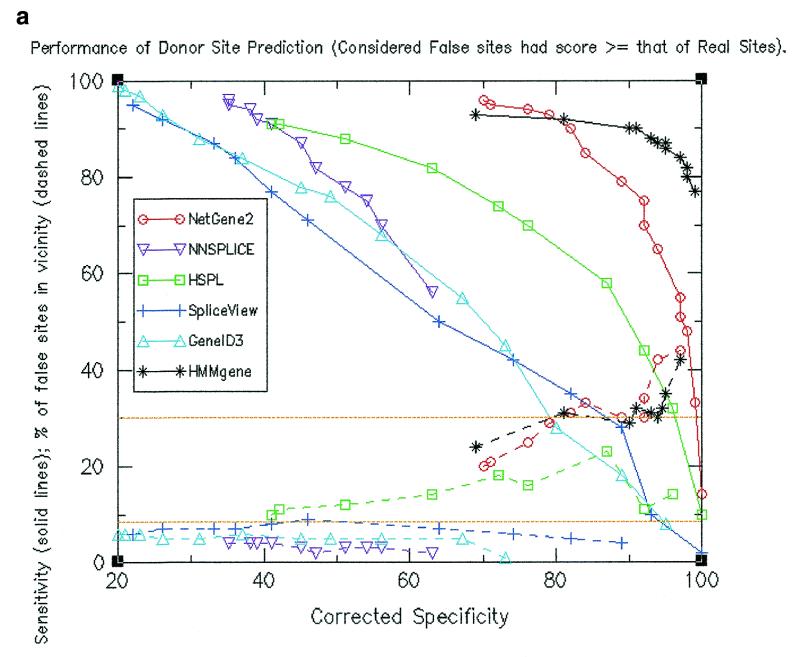
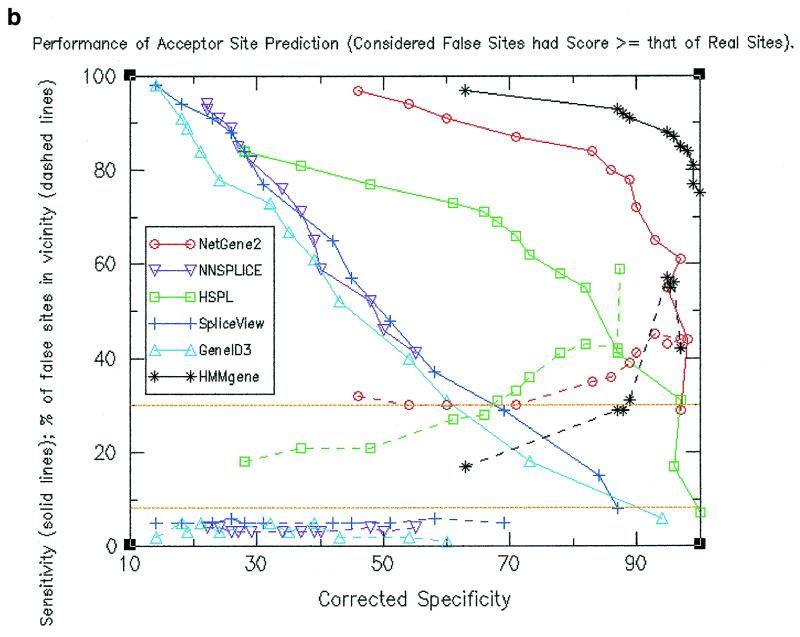
Figure 3.
(a) Performance of donor site prediction programs in terms of corrected specificity and sensitivity (shown by solid lines). Also shown are corrected percentage of false positive donor sites that are proximal (shown by dashed lines). Only those false positive donor sites with a score ≥ that of real donor sites were considered. (b) Performance of acceptor site prediction programs in terms of corrected specificity and sensitivity (shown by solid lines). Also shown are the corrected percentage of false positive acceptor sites that are proximal (shown by dashed lines). Only those false positive donor sites with a score ≥ that of real acceptor sites were considered.


