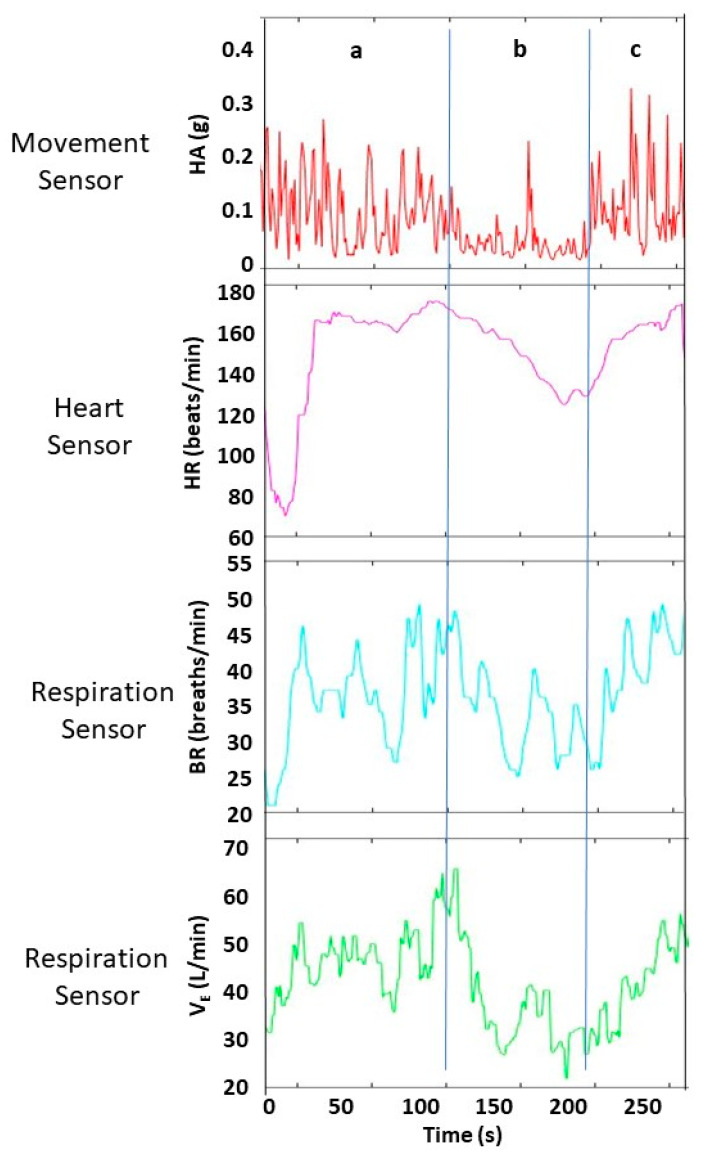
Figure 4.
Examples of raw data collected during lead climbing from three types of wearable sensors (movement, heart, respiration). Data are shown across three consecutive periods (a–c) with different climbing activities (Breen 2022, [14]). First period (a) corresponds to climber interacting with climbing surface (e.g., hold change, rope clipping) that shows increasing heart rate (HR), breathing rate (BR), minute ventilation (VE) and many large peak-to-valley changes in hip acceleration (HA). Each HA peak often corresponds to a hold change. Second period (b) corresponds to immobility (e.g., resting, route finding) and stationarity (e.g., chalking, limb shaking) that shows decreasing HR, BR, VE, and mostly small peak-to-valley changes in HA. Third period (c) corresponds to climber interacting with climbing surface (e.g., hold change, rope clipping) that shows characteristics similar to period (a).

