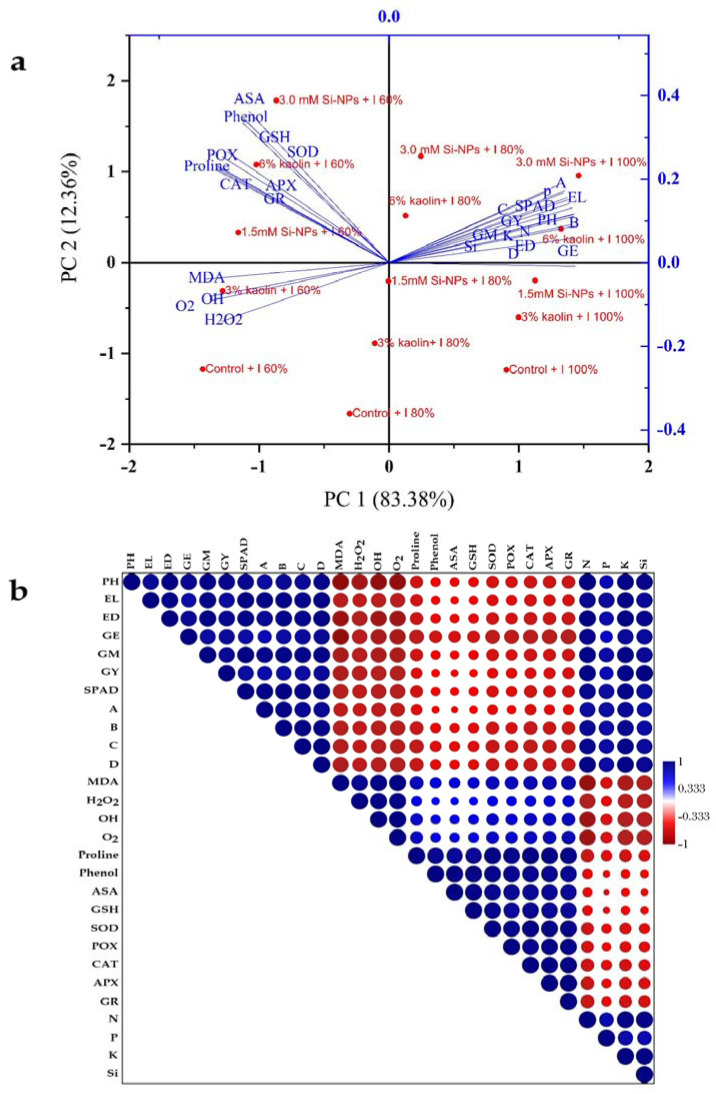
Figure 7.
(a) An analysis of the correlations between treatment variables in maize plants using principal component analysis (PCA). (b) Based on the mean values of different parameters reported in this study, the heat map confirms the association between quantitative statistical parameters. PH; plant height, EL, ear length; ED, ear diameter; GE, number of grains per ear−1; GM, 100-grain mass; GY, grain yield; A, net photosynthetic rate; B, stomatal conductance; C, intercellular CO2 concentration; D, transpiration rate.

