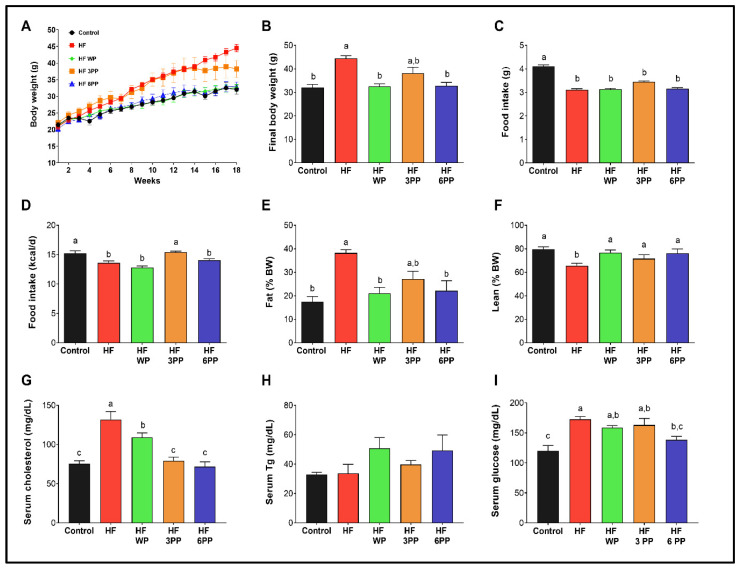
Figure 2.
Body weight, food intake expressed as grams (g) or energy (kcal/d), body fat and lean mass content and circulating cholesterol, triglycerides and glucose. (A) Body weight change throughout the study, (B) body weight at the end of the study, (C) food intake in grams/day, (D) Energy intake in kcal/day, (E) fat mass content (percentage), (F) lean mass content (percentage), (G) Serum cholesterol, (H) Triglycerides and (I) Glucose of mice fed the Control diet (Control), a High-fat diet (HF) or an HF diet containing whole pecans (HF WP), 3 mg (HF 3PP) or 6 mg (HF 6PP) of a pecan phenolic extract. Results are presented as the mean ± S.E.M., n = 6. Differences were considered statistically significant at p < 0.05. Statistical differences between groups are indicated with lowercase letters, where a > b > c.

