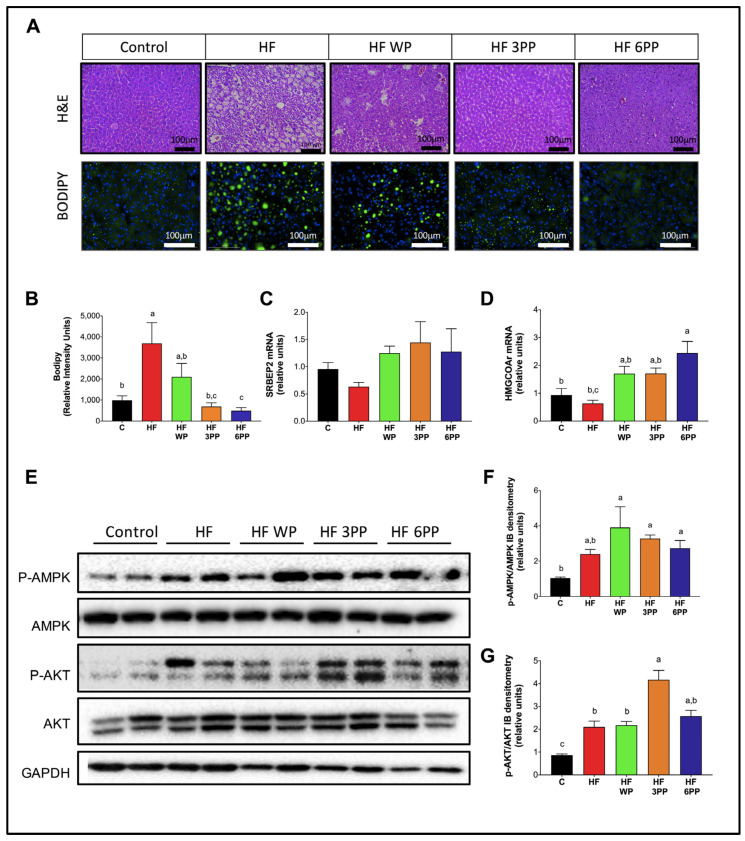
Figure 8.
Hepatic histomorphology H&E or BODIPY staining (A), BODIPY densitometric (B), SREBP-2 and HMGCoA mRNA relative units (C,D), phospho-AMPK, total AMPK; phospho-AKT, total AKT, and GAPDH immunoblot (E), Densitometric quantification of p-AMPK/AMPK ratio (F) and Densitometric quantification of p-AKT/AKT ratio (G) of mice fed the Control diet (Control), a High-fat diet (HF) or an HF diet containing whole pecans (HF WP), 3 mg (HF 3PP) or 6 mg (HF 6PP) of a pecan phenolic extract. Results are presented as the mean ± S.E.M., n = 6. Differences were considered statistically significant at p < 0.05. Statistical differences between groups are indicated with lowercase letters, where a > b > c.

