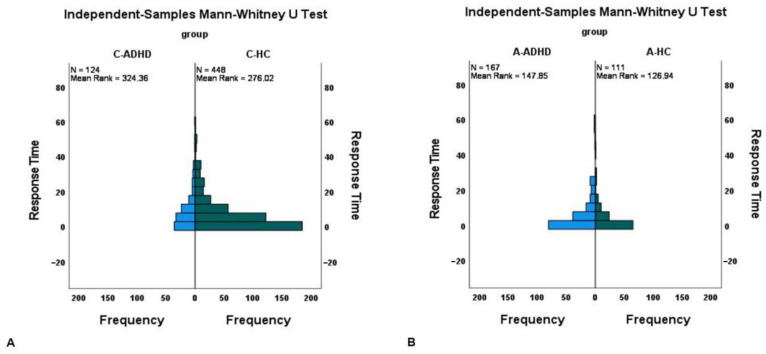
Figure 1.
The frequency distribution of the Response Time calculated between the sleep end and the pressing of the event-marker button was presented in the Y axis of both graphs (A), on the left, for children sample and (B), on the right, for adult sample. The Response Time calculated as the difference between the sleep end and the pressing of the event-marker button (in minutes) represents the PM activity-based performance of the participants.

