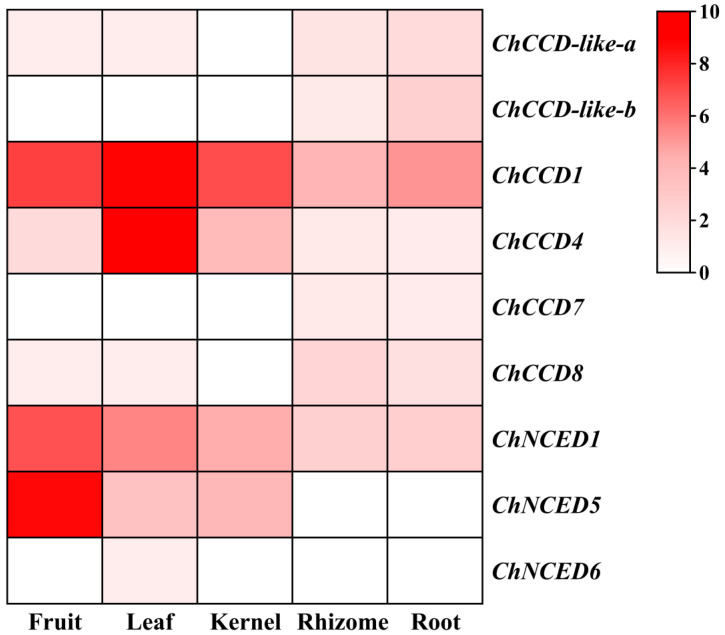
Figure 3.
Heatmap for the transcriptome data-based expression analysis of ChCCOs in the fruit, leaf, kernel, rhizome and root of C. humilis. For heatmap drawing, log2(FPKM + 1) values of ChCCO genes were used. The redder the color, the higher the gene’s expression, and white represents no expression.

