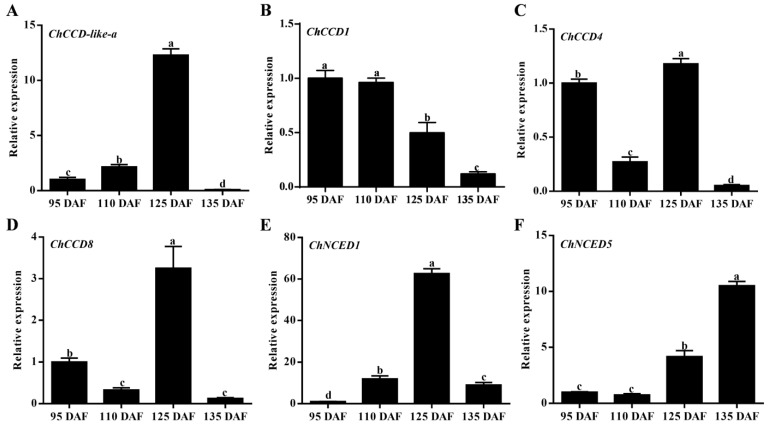
Figure 4.
Quantitative real-time PCR analysis results of ChCCOs in fruits at four different ripening stages. (A–F) represents expression analysis result for ChCCD-like-a, ChCCD1, ChCCD4, ChCCD8, ChNCED1 and ChNCED5, respectively. DAF: days after flowering. The different letters above the columns represent significant differences at p < 0.05 level.

