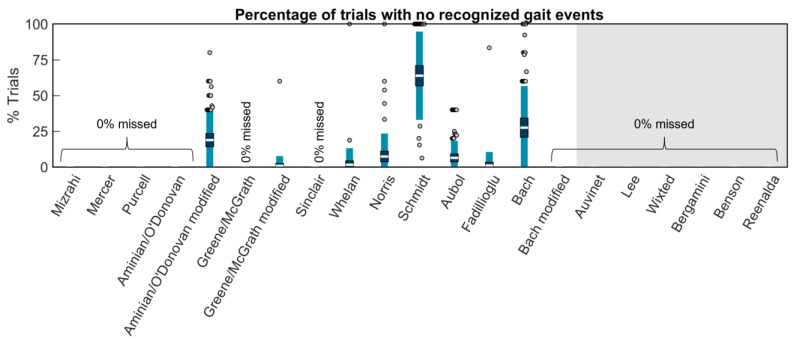
Figure 4.
The white horizontal line represents the mean percentage of trials per participant without any gait events recognized; dark blue represents ±95% confidence interval (±1.96 SEM) around the mean; and light blue represents ±1 SD around the mean. Gray dots represent participants outside ±1 SD. No bars indicate that gait events were identified in every trial for every participant. Methods on the white background are for wearables on the shank. The methods on the gray background are for wearables on the sacrum/low back.

