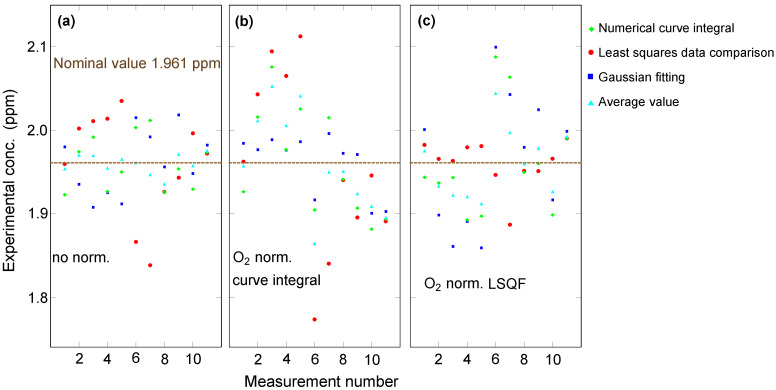
Figure 6.
The concentration of H was extracted from vibrational SRS spectra using different methods. For the data in panel (a), no normalization was applied. For the data in panels (b,c), normalization by the O concentration extracted by the curve integral method and the least-squares comparison method was applied, respectively.

