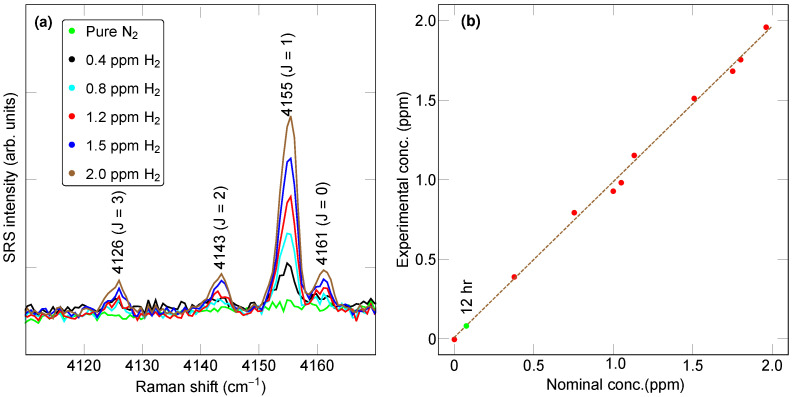
Figure 7.
(a) Hydrogen Raman spectrum under various concentrations of H as indicated, obtained by diluting the reference gas in pure nitrogen. (b) Graph of experimentally obtained concentration as a function of nominally mixed H concentration. For the green data point, the exposure time was 12 h, while, for all the other points (red), it was 10 min. The pressure was 0.2 MPa.

