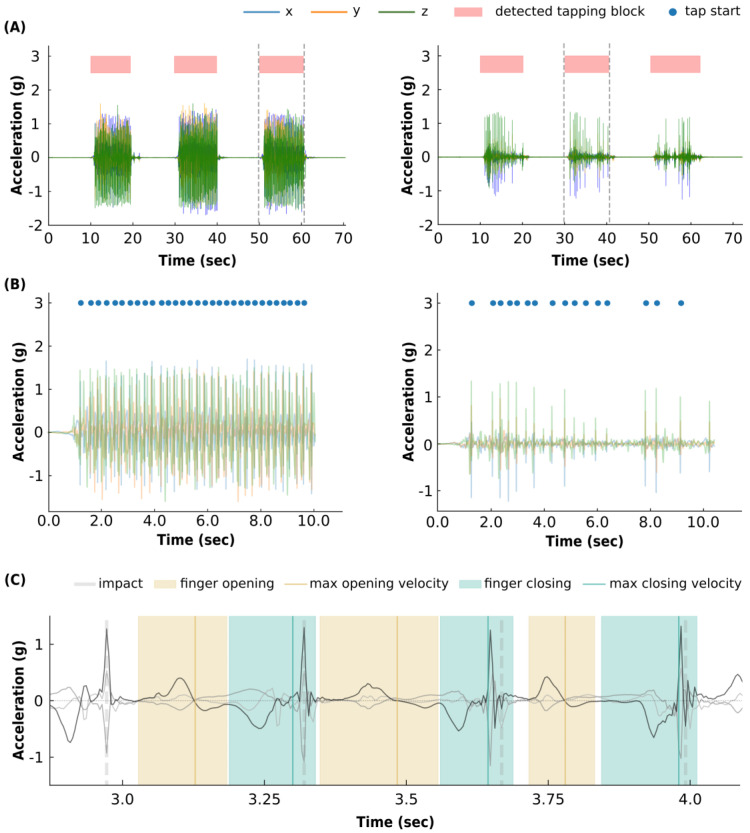
Figure 1.
Automated finger tapping detection functions. (A): The automated tapping block detection results in two exemplary accelerometer traces containing three 10-s blocks of tapping activity. The function successfully detects repetitive 10-s tapping blocks present in the tri-axial accelerometer data, highlighted as the red blocks. The function performs well for taps with high (left panel) and low (right panel) amplitudes. (B): The automated single tap detection, performed on the tapping block between the dotted lines in the panel above. The blue dots represent the time points that the function detected impacts, which are used to recognize the moment of index finger and thumb closing. (C): Exemplary accelerometer trace snippet highlighting the temporal time points used for single tap feature extraction. Yellow shades indicate index finger opening and light-blue shades indicate index finger closing. The vertical yellow and blue lines indicate the moments of maximum speed within the finger opening and closing, respectively. Finger opening speed increases until the positive peak (in g) crosses 0 (vertical yellow line). Similarly, finger closing (downwards movement) speed increases during the negative acc-peak until the acc-signal crosses 0 g (vertical blue line). The vertical gray dotted lines represent the impact moment detected. The three accelerometer axes are shown in black and gray.

