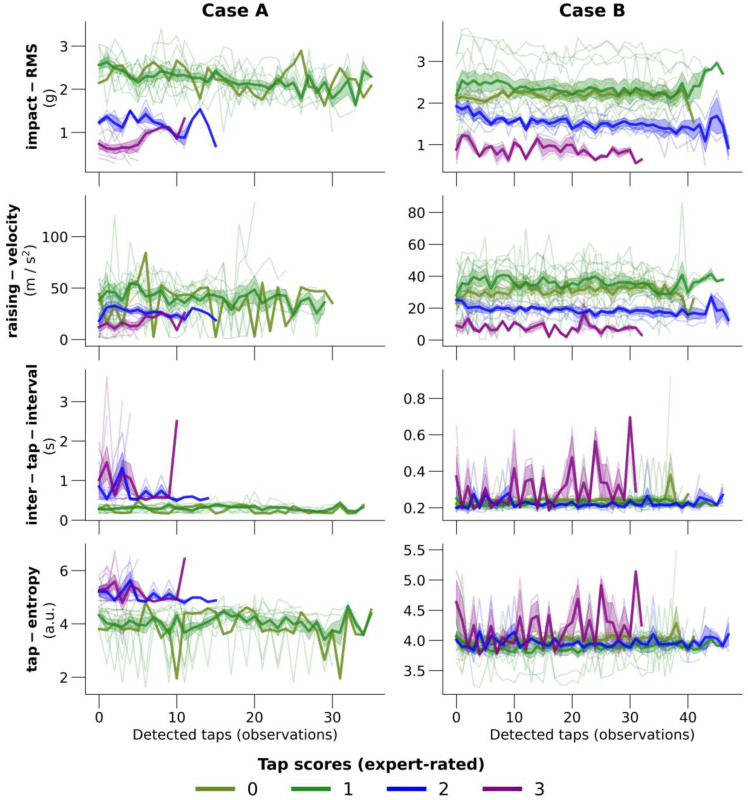
Figure 3.
Exemplary cases of the kinematic features with the highest predictive performance. A total of two subjects from the holdout validation cohort are shown, each in one column. The four features are chosen based on the random forest feature importance (see Figure S2). Every thin line represents the feature values during one tapping block. Lines have various lengths of observations due to the various number of detected taps per tapping block. The thick lines represent the mean values of detected taps within tapping blocks of the same expert-rated score (i.e., mean value of first tap values in blocks with score 1, mean value of second tap values in blocks with score 1, etc.). Line colors indicate the expert-rated tapping score; olive green: 0, dark green: 1, blue: 2, purple: 3. ITI: inter-tap-interval.

