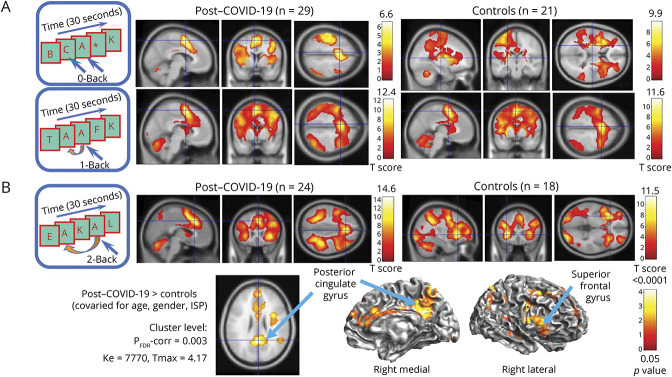
Figure 2. Group fMRI Activation Maps and Group Comparison During the N-Back Tasks.
(A) The 0-back and 1-back task paradigms, as shown sequentially on the presentation computer during the fMRI, are illustrated on the left, and the typical activation maps for each group are shown in 3 orientations. No group differences were found on these tasks (hence, the group comparison data are not shown). (B) The 2-back task paradigm is illustrated on the left, and the group activation maps show the typical WM activation patterns, including activation in the bilateral dorsolateral or inferior prefrontal cortices, the anterior cingulate cortex, the precuneus and bilateral posterior parietal and occipital regions, and the cerebellum. Note the higher Tmax scores on the color scale for the 2-back task than the 0-back and 1-back tasks shown above. Cortical surface maps and an axial image below show the brain regions with greater activation in participants with post–COVID-19 compared with healthy controls on the 2-sample t tests (covaried for age, gender, and Index of Social Position). Clusters with corrected p ≤ 0.05 and ≥100 voxels are shown, with cluster maxima shown in the posterior cingulate gyrus and the superior frontal gyrus (see also Figure 3). COVID-19 = coronavirus disease 2019; WM = working memory.

