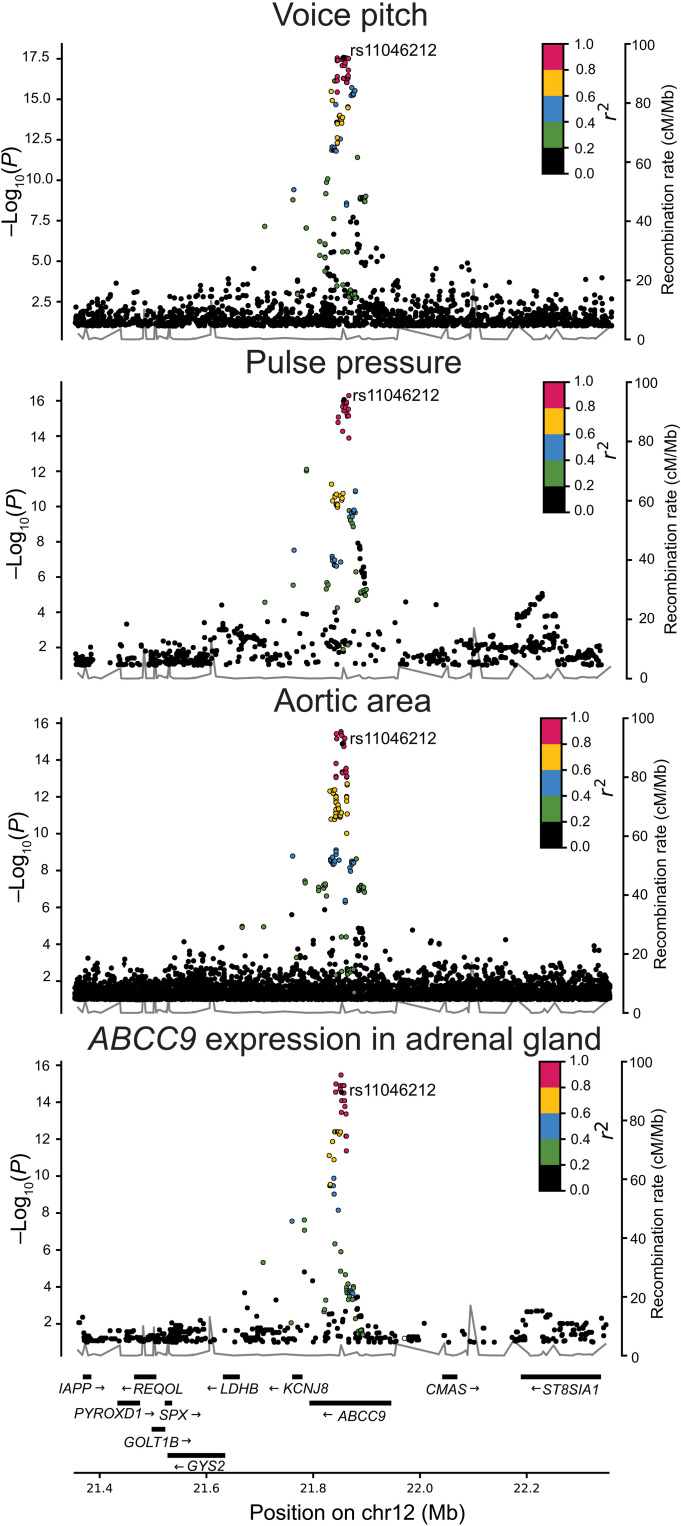
Fig. 4. Regional plots of ABCC9 variants associated with voice pitch, pulse pressure, aortic area, and ABCC9 expression in adrenal gland.
Variants are plotted according to their genomic position (x axis) and the −log10 P value for association with the phenotype (left y axis). The lead variant rs11046212-T is shown as purple; other variants are colored to reflect their correlation (LD) with the lead (those in red are highly correlated with the lead variant). Nearby genes are shown on the bottom.

