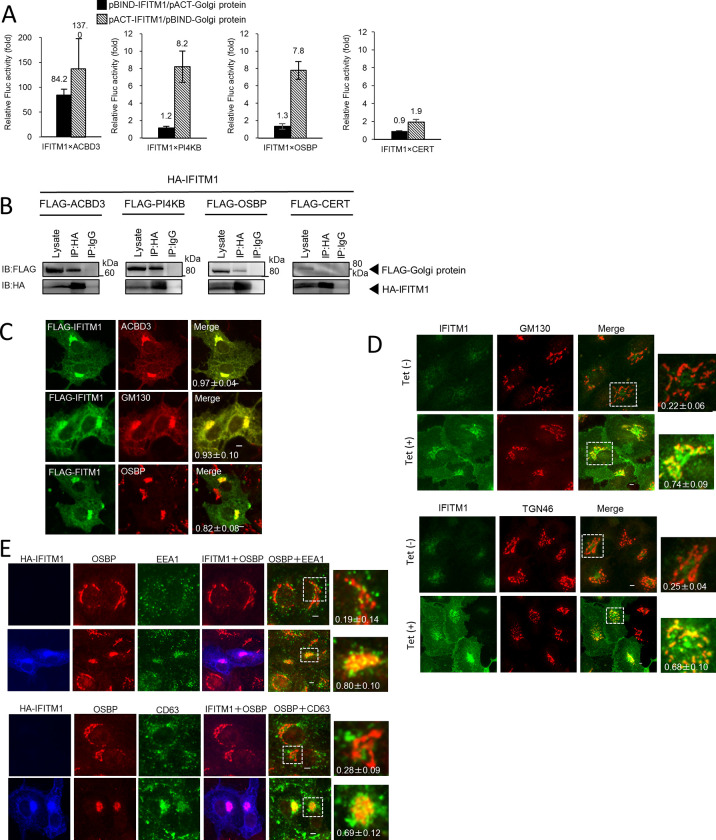
Fig 4. Subcellular localization analysis of overexpressed IFITM1.
(A) A mammalian two-hybrid analysis was carried out to examine interactions between IFITM1 and ACBD3, PI4KB, OSBP, or CERT, and the results are shown as described in Fig 3A. Data are the mean ± SD of at least three independent experiments. (B) HA-tagged IFITM1 and FLAG-tagged ACBD3, PI4KB, OSBP, or CERT were cotransfected into 293T cells, and the cell lysates were subjected to immunoprecipitation with anti-HA antibody or control IgG. The resulting immunocomplexes and whole-cell lysates were detected by anti-FLAG and anti-HA antibodies. (C) Vero cells were transfected with FLAG-IFITM1. At 24 h, the cells were labeled with anti-FLAG and anti-ACBD3 (top), anti-PI4KB (middle), or anti-OSBP (bottom) antibodies. (D) Vero IFITM1 cells were incubated with Tet (−) or Tet (+) for 72 h, and the cells were fixed and double stained with the indicated antibodies. (E) Vero cells were transfected with HA-IFITM1. At 24 h, the cells were labeled using anti-HA, anti-OSBP and anti-EEA1, or anti-CD63 antibodies. Bars, 4 μm. Pearson correlation coefficient analyses for data were obtained from ≥10 cells. Correlation coefficients are presented as the mean and standard deviation (C-E).

