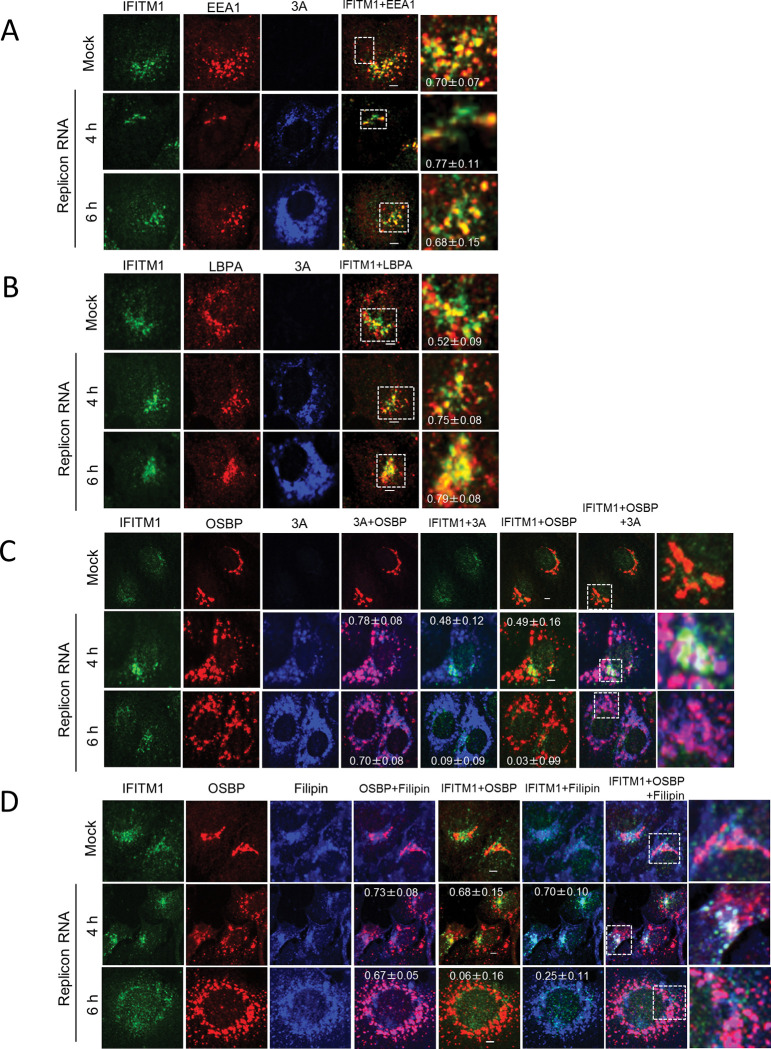
Fig 6. Endogenous IFITM1 localizes to both endosomes and the Golgi in cells with low 3A expression.
(A–D) Vero cells were mock electroporated or electroporated with replicon RNA. After 4 or 6 h, the cells were fixed and stained using the indicated antibodies or filipin III (for cholesterol staining). Bars, 4μm. Pearson correlation coefficient analyses for data were obtained from ≥10 cells. Correlation coefficients are presented as the mean and standard deviation.

