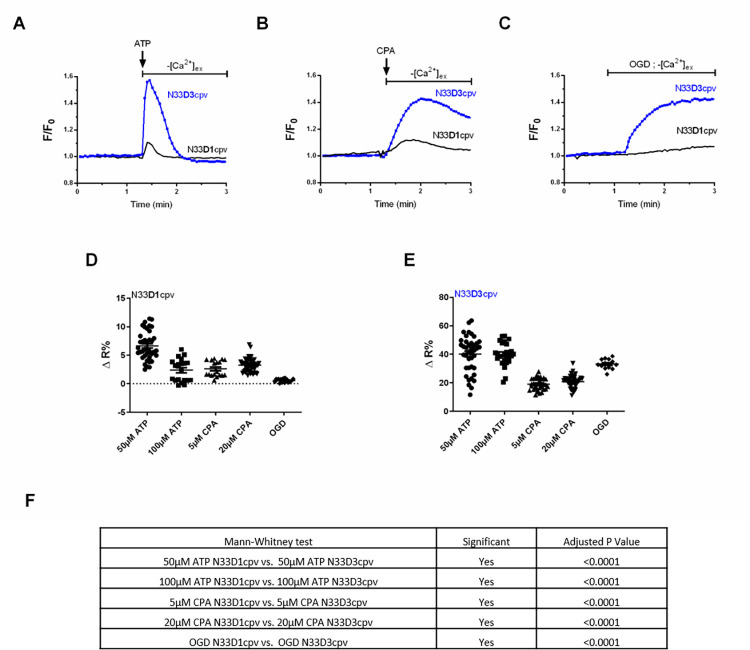
Fig 2. Sensitivity of N33D1cpv and N33D3cpv biosensors in OMM.
(A) Change in [Ca2+]OMM induced by a 100 μM ATP stimulation, using either N33D1cpv (black) or N33D3cpv (blue) in absence of external Ca2+. (B) Changes in [Ca2+]OMM induced by 5 μM cyclopiazonic acid (CPA) stimulation, using N33D1cpv (black) or N33D3cpv (blue) in absence of external Ca2+. (C) Changes in [Ca2+]OMM occurring during an oxygen glucose deprivation (OGD), using N33D1cpv (black) or N33D3cpv (blue) in absence of external Ca2+. (A-C) Representative average FRET-ratio (F) normalized with the baseline FRET-ratio value (F0). (D-E) Dot plots represent the mean ±SEM of ΔR% of the 2 probes (N33D1cpv and N33D3cpv, respectively), where ΔR% is calculated as % of the steady-state value (R1) and its maximum value (R2) after drugs stimulation (ATP, CPA) or OGD. N = 3–4, Fig 2D n = 39, 20, 18, 48, 19 and Fig 2E n = 40, 25, 34, 45, 13 respectively. (F) Statistical comparison of the two biosensors for each stimulus with a Mann-Whitney test (Normality Kolmogorov-Smirnov test).

