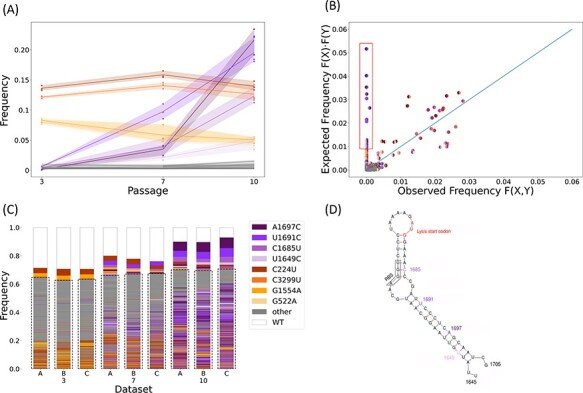
Figure 2.

SNV and genome frequencies across time. (A) Markers show SNV frequencies in the three replicas, with high-frequency SNVs in purple, founder SNVs in brown-orange, and all other low-frequency SNVs in gray. The shaded area illustrates the range of observed values. (B) Observed versus expected frequencies of pairs of SNVs. For a pair of SNVs denoted by X and Y, F(X) and F(Y) are their frequencies across all genotypes, respectively; F(X)F(Y) is the expected frequency of the pair assuming independence; and F(X, Y) is the observed frequency of the pair across all genotype; frequencies are taken from all three replicas at passage 10. The diagonal line represents the independence of the pair of SNVs, i.e. F(X, Y) = F(X)F(Y). Founder SNV pairs were excluded from this analysis. Pairs of beneficial SNVs are surrounded by a red box. (C) Genetic diversity for each replica and passage. When a genome contains more than one high-frequency SNV, the color of its box is defined by the first SNV in the order of appearance in the legend. The genomes are ordered by their frequency in each dataset and the number of SNVs within them. Rare genotypes are defined as present in less than 0.5 per cent of a sample and are boxed with a dashed line. (D) The RNA structure where all beneficial SNVs occur is inferred using Mfold (Zuker 2003) and in line with the experimentally resolved structure (Dai et al. 2017). This region spans the end of the coat gene and the overlapping lysis gene. All beneficial SNVs are synonymous with respect to the coat gene and non-synonymous with respect to the lysis gene. ‘RBS’ marks the ribosomal-binding site for the lysis gene.
