
Figure 4.
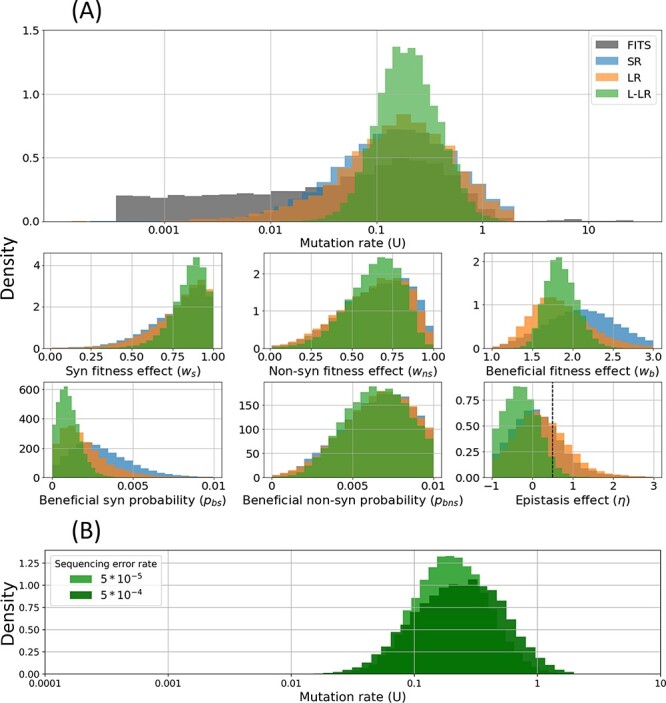
Posterior distributions of model parameters inferred for MS2. (A) Posterior distributions of the mutation rate using three summary statistics for the mutation rate produce a substantially narrower distribution compared to FITS (single-locus Wright–Fisher model with rejection sampling applied to all synonymous SNVs). Shown are marginal posteriors of model parameters using ensemble SNPE with three different summary statistics. In most cases, the L-LR produces a narrower posterior, and generally all posteriors agree. For epistasis, the left of the dotted line are values indicating sign epistasis. (B) The marginal posterior distribution of the mutation rate U inferred with ensemble SNPE with the L-LR summary statistic compared to an estimate that assumes a tenfold increase in the sequencing error rate. See Fig. S11 for joint posterior distributions of the mutation rate with other model parameters.