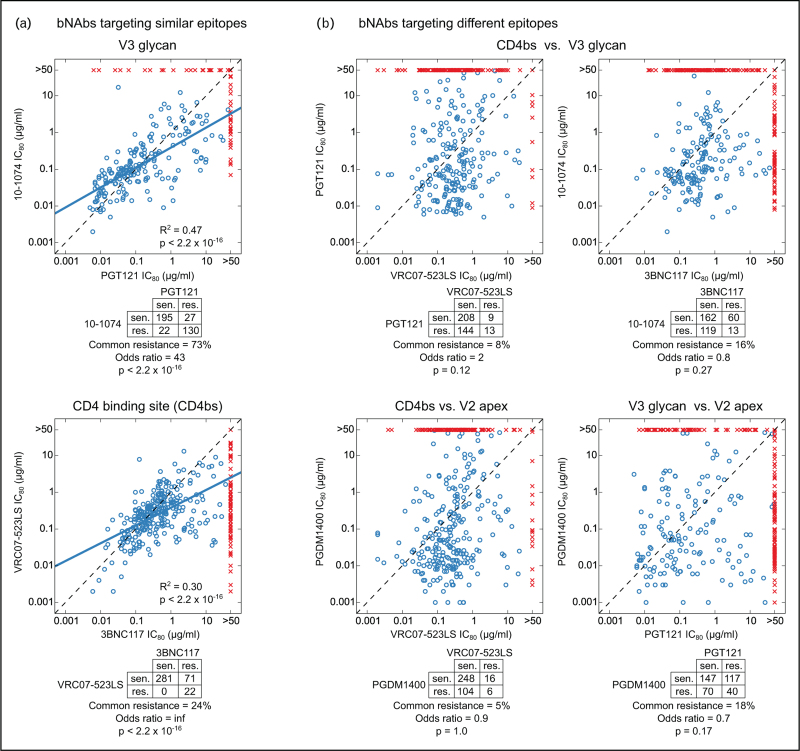
FIGURE 2.
Complementarity in neutralization by bNAbs targeting different epitopes. (a) Correlated neutralization between bNAbs that target similar epitopes. Top and bottom panels show two distinct bNAbs targeting either V3-glycan epitope or CD4bs epitope, respectively. Each point in the scatter plot shows IC80 titers for the two bNAbs against the same virus. Blue circles indicate viruses sensitive to both bNAbs (IC80 < 50 μg/ml), while red crosses indicate viruses resistant to one or both bNAbs (IC80 > 50 μg/ml). Dotted lines indicate identity, and thick blue lines indicate the linear regression trend line between log10 IC80 titers using only the viruses sensitive to both bNAbs. Square of the Pearson correlation coefficient (R2) and the corresponding P-value is indicated. The contingency table below each scatter plot shows the number of viruses sensitive to both bNAbs (top left), resistant to either bNAb but sensitive to the other (off-diagonal) and resistant to both bNAbs (bottom right). The percentage of viruses that are resistant to both bNAbs from the number of viruses resistant to either bNAb is reported, along with the odds ratio and Fisher's exact test P-values. (b) Uncorrelated neutralization between bNAbs targeting different epitopes. Same format as panel (a), except neutralizing titers of bNAbs targeting different epitopes are analyzed. In contrast to bNAbs targeting similar epitopes in (a), bNAbs targeting different epitopes in (b) do not show significant correlation in IC80 titers (R2 = 0.02–0.07, thus linear regression trends are not shown) and have no significant overlap in sensitive/resistant viruses. Neutralization data was obtained from CATNAP on the Los Alamos HIV Database (www.hiv.lanl.gov) and comes from different studies, as previously described [7]. bNAb, broadly neutralizing antibody.

