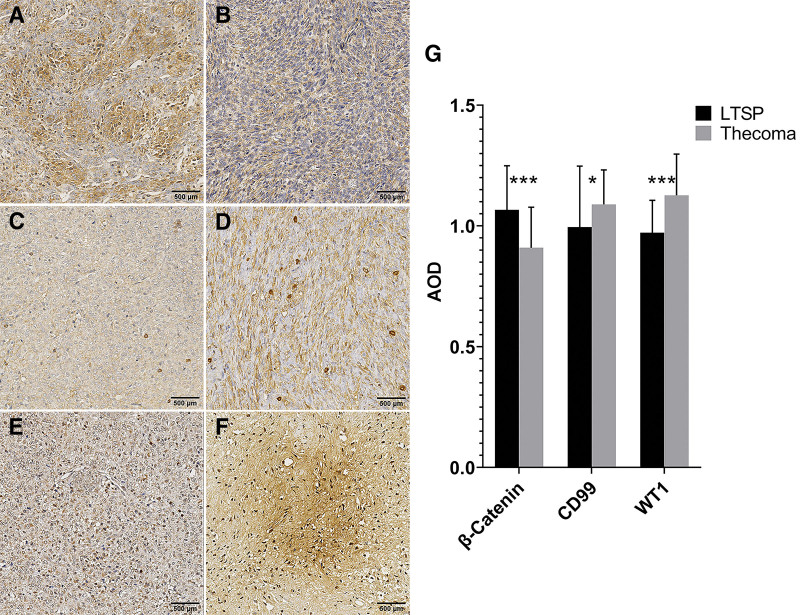
Figure 3.
Molecular pathological markers show significant differential expression between LTSP and thecoma. (A and B) Immunohistochemical staining of the luteinized cells is (A) diffusely positive for Catenin beta-1 (β-Catenin) and the thecoma cells are (B) negative with β-Catenin. (C–F) CD99 antigen (CD99) and Wilms tumor protein (WT1) are (C, E) weak in the luteinized cells but (D, F) strongly positive in the thecoma cells. (G) Statistical analysis of the 3 markers. Data are expressed as mean ± SD. n = 9 to 10 sections per marker (G, LTSP); n = 81 to 87 sections per marker (G, Thecoma). *P < .05, ***P < .001 (t test). Scale bar, 500 μm. AOD = average optical density, LTSP = luteinized thecoma associated with sclerosing peritonitis.

