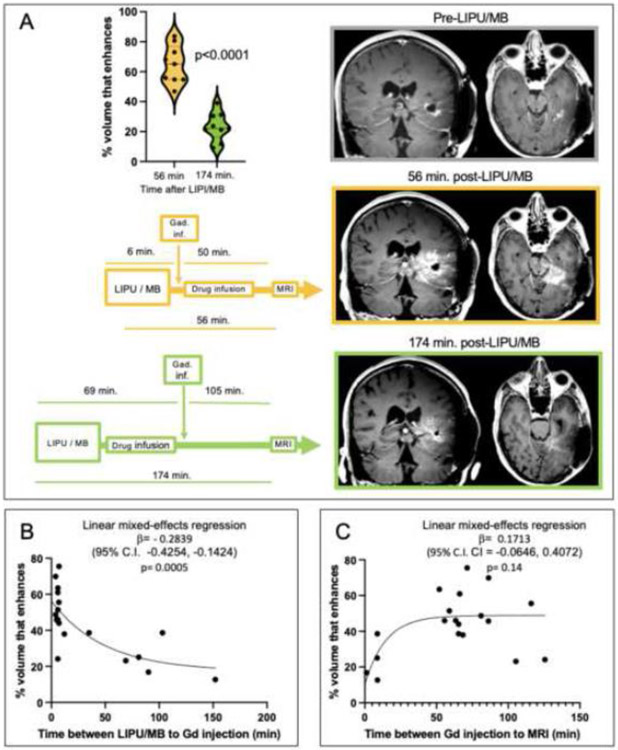
Figure 2. Effect of timing of brain sonication, gadolinium infusion and MRI on post-LIPU/MB brain enhancement.
(A) Schematic of timing of gadolinium infusion (Gad. inf) and MRI relative to LIPU/MB, MR images and enhancement quantification through a violin plot comparing enhancement of peri-tumoral brain that was targeted by each of the SC9 ultrasound probes (n=9) on images obtained with gadolinium infusion early (6 minutes after the beginning / 2 minutes after finishing LIPU/MB) after sonication, and subsequent MRI done after drug infusion (top) versus with deliberate delay of gadolinium infusion and MRI (bottom) on the same patient. P value was calculated using student’s two-tailed unpaired t-test. Scatter plot demonstrating relationship between time between sonication and Gd infusion (B) or time between Gd infusion and beginning of MRI (C) vs. enhancement of peri-tumoral brain targeted by SC9 ultrasound probes in 19 sonication cycles conducted in 17 patients. A one-phase exponential decay model was fitted to the data and strength of correlation was determined using a linear mixed-effects regression model. To quantify the % of sonicated brain volume with BBB opening i.e. enhancement after sonication, a region of interest within the brain that was targeted by each emitter that was not enhancing prior to sonication was used as the denominator. Images of LIPU/MB based BBB opening for all patients are available on appendix p. 14.

