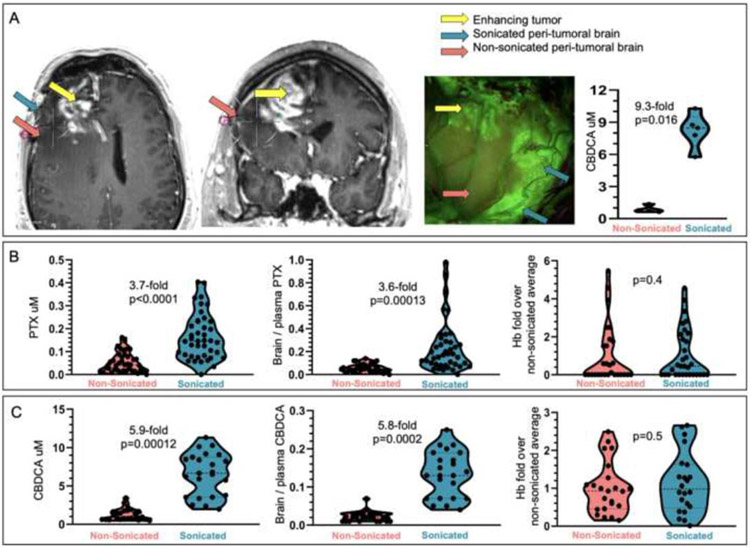
Figure 4. Analysis of the effect of LIPU/MB on the concentration of PTX and CBDCA in the peri-tumoral brain.
(A) Example of a case where intraoperative LIPU/MB was performed in the peri-tumoral brain for pharmacokinetic analysis of CBDCA concentrations. Stereotactic coordinates for each biopsy site were recorded on the pre-operative MRI are indicated by differently colored arrows in axial and coronal planes, and on the photo from surgical microscope. Violin plots show absolute CBDCA concentrations for biopsies corresponding to the sonicated and non-sonicated peri-tumoral brain (red arrow for non-sonicated, green for sonicated brain, and yellow for tumor) (n=5 biopsy samples for sonicated brain, and n=4 for non-sonicated brain). (B) Violin plots showing absolute drug concentrations (left), brain / plasma ratios using plasma levels at 45 minutes after LIPU/MB) (center), and corresponding % hemoglobin (Hb) content (right) (presented as ratio of Hb % for sonicated/non-sonicated tissue) following IV administration of albumin-bound paclitaxel (ABX) (n=7 patients, 81 biopsy samples, 41 sonicated and 40 non-sonicated, out of which 28 non-sonicated and 32 sonicated were also analyzed for Hb) and (C) Carboplatin (CBDCA) (n=3 patients, 48 biopsy samples, 23 sonicated and 25 non-sonicated, out of which 22 sonicated and 23 non-sonicated biopsies were also analyzed for Hb). For A, p value was calculated using the Wilcoxon rank sum exact test. For B and C, p values and fold/times changes of means were calculated using mixed effects model.

