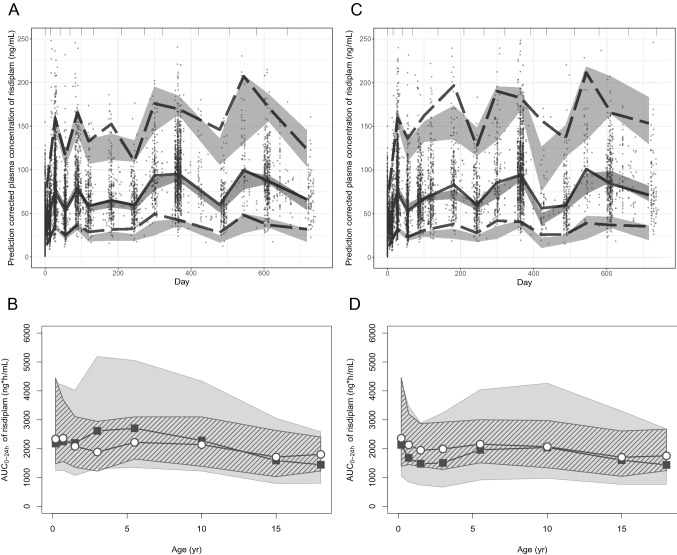
Fig. 2.
Evaluation/validation of the PPK, Mech-PPK and PBPK models of risdiplam. a pc-VPC of the PPK model of risdiplam for the dataset that contains 525 subjects. Individual observations corrected by the respective prediction are shown with solid circles. Gray areas are 95% prediction intervals of the 2.5th, median and 97.5th percentiles of predictions. Dotted and solid lines show the 2.5th and 97.5th percentiles and the median of the observations, respectively. b Validation of the risdiplam PBPK model by comparing predicted AUC0-24h (gray shade) with the individually estimated AUC0-24h using post- hoc PK parameters of the final PPK model for the 270 paediatric SMA patients aged 2 months–18 years in the model validation dataset (ESM Table S2) who received an approved dose of risdiplam (0.2, 0.25 mg/kg or 5 mg) [6] for more than 25 days. The default demographic model supplied in the SimCYP paediatric module was used. The gray and striped shapes show the 90% prediction interval or 5th–95th percentiles of the observations, respectively. Geometric means of simulated (solid squares) and observed (open circles) values are shown. Geometric means of the simulated risdiplam AUC0-24h are all within 0.8- to 1.2-fold of the observations, except for AUC0-24h of 2–4 years (1.4). c pc-VPC of the Mech-PPK model of risdiplam with the in vivo FMO3 ontogeny Model 6. Individual observations corrected by the respective population prediction are shown with solid circles. Gray areas are 95% prediction intervals of the 2.5th, median and 97.5th percentiles of predictions. Dotted and solid lines show the 2.5th and 97.5th percentiles and the median of the observations, respectively. d Prediction of risdiplam AUC0-24h by the updated paediatric PBPK model after implementation of the estimated in vivo FMO3 ontogeny function was compared with the individually estimated AUC0-24h using post-hoc PK parameters of the final PPK model for 362 paediatric patients with SMA who received an approved dose of risdiplam (0.2, 0.25 mg/kg or 5 mg) [6] for more than 25 days. A customized demographic model for SMA patients [18] was used. The gray and striped shapes show the 90% prediction interval or the 5th–95th percentiles of the observations, respectively. Geometric means of simulated (solid squares) and observed (open circles) values are shown. Geometric means of the simulated risdiplam AUC0-24h were within 0.8- to 1.2-fold of the observations in children aged 2–7 months and > 4 years, and 0.76- to 0.79-fold in children aged 7 months to 4 years. PPK population pharmacokinetic, PBPK physiologically based pharmacokinetic, Mech-PPK mechanistic population pharmacokinetic, pc-VPC prediction-corrected visual predictive check, AUC0-24h area under the concentration-time curve from time zero to 24 h, PK pharmacokinetic, SMA spinal muscular atrophy, FMO3 flavin-containing mono-oxygenase 3

