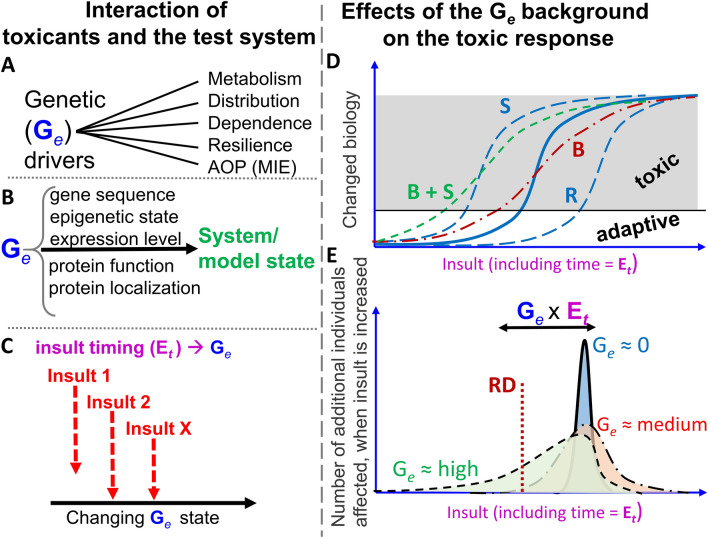
Fig. 1.
Relationship of insult, Ge and toxicity outcomes. Several aspects of mutual interactions are displayed. The left side (subfigures A–C) deals with interactions of toxicants and test system (toxicants are considered here in a very wide sense, comprising all adverse influences, such as chemicals, radiation, infectious agents and other stressors). The right side (subfigures D–E) deals with effects of the Ge background on the toxic response. A The genetic component (Ge state) can affect toxicity in many ways. Five major drivers are shown and further explained in the main text. MIE refers to molecular initiating events (MIE of adverse outcome pathways (AOP)). B The genetic component in the classical G × E concept is not adequately described by “primary genetic sequence”. In reality, it is not the nucleic acid component of a gene that determines toxic responses, but the function of the protein that is encoded by the gene. The “real” meaning of “G” includes therefore at least the factors: gene sequence, epigenetic state, expression level, and post-translational processing. Altogether, this Ge state determines the properties of the model system. C The environment (E) component of the classical G × E concept is composed of chemical, physical and life style factors. It is sometimes considered independent of (orthogonal to) genetic (Ge) influences. This is an oversimplification in situations of prolonged or repeated insult. Under such conditions, it needs to be considered that insults not only contribute to toxicity as an endpoint, but that they also alter the test system. This involves in many cases a change of Ge. Thus, a system with a given initial Ge state during the first insult may have a different Ge state upon a secondary or later insult, because the first insult changed the system. The timing of exposures to toxicants or other insults (Et) needs consideration for a quantitative strategy to predict the extent and variability of toxicity. D The solid (blue) line shows a typical biological response to an insult (assumed to be the average within a test population): with an increasing insult, the biological system changes. It is assumed that up to a certain level, the changes are within a normal homeostatic regulation range and can be called adaptive; beyond this threshold (grey area) the changes are classified as toxicity. The dashed curves exemplify responses in particularly sensitive (S) or resistant (R) individuals. The dash-dotted line (B, red) shows a broadened response (i.e. it refers to a population with more variation). The short-dashed line (B + S, green) shows a broadened response in a particularly sensitive subpopulation. While the insult is clearly defined by the values on the x-axis, the resultant biological deviation differs between members of the population. The sensitivity differences of its members are assumed to be due to genetic variation. The toxicity threshold is therefore reached at different insult intensities for individuals with different genetic background. E There is always an uncertainty of binary classifications (toxic vs non-toxic), which is largest at insult levels corresponding to the toxicity threshold. This can be visualized by frequency distribution curves showing how many additional individuals would be classified as affected (toxicity onset) at the next incremental insult step. If there is no (or very low) genetic variability (Ge = 0, solid, blue), the uncertainty distribution is narrow. A moderate genetic variability (dash-doted, red) leads to broadening of the distribution (some individuals affected at clearly lower toxicant levels, some at clearly higher levels). A high genetic variability (dashed, green) leads to further broadening, and may lead to asymmetric shapes, e.g. with a particularly sensitive sub-population. Given a certain reference dose (RD, e.g. accepted daily intake), the Ge = 0 population would be safe. In the red (dash-dotted) population, some individuals would be endangered. Many individuals in the green (dashed) population would be victims of toxicity. Thus, the interaction of genetic factors (Ge) and insult (including its timing, Et), i.e. Ge × Et, determines response variability and affects setting of safe reference doses

