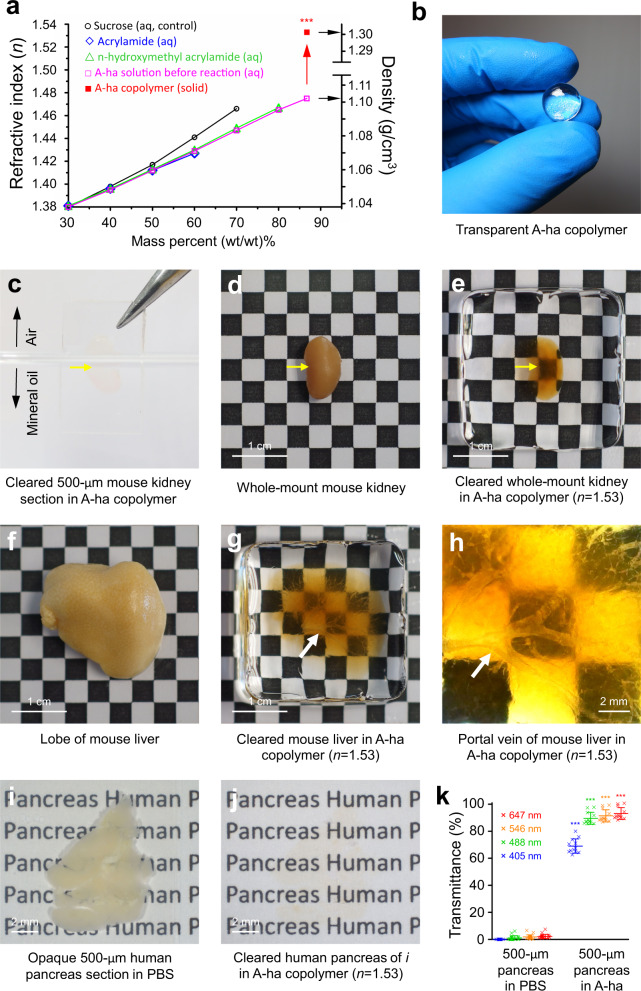
Fig. 1. Synthesis of high-n A-ha copolymer for tissue clearing.
a Increases in refractive index n and density at high mass fraction of monomers (acrylamide and n-hydroxymethyl acrylamide) and after photo-polymerization (arrow). ≥12 repeats per data point. ***p < 0.001 vs. A-ha monomer solution (two-sided unpaired Student’s t test). b Rigid and transparent high-n A-ha copolymer. c–k Optically cleared tissues in A-ha copolymer (representative images). c–e mouse kidney (yellow arrow). f–h mouse liver (enlarged in h; arrow, portal vein). i, j vibratome section of human pancreas in PBS vs. A-ha copolymer. The drastic increase in transmittance in A-ha is quantified in k (n = 21 and 12 independent measurements in PBS and A-ha conditions, respectively; ***p < 0.001 vs. PBS, two-sided unpaired Student’s t test). Data are presented as means ± standard deviation. Source data are provided as a Source Data file.

