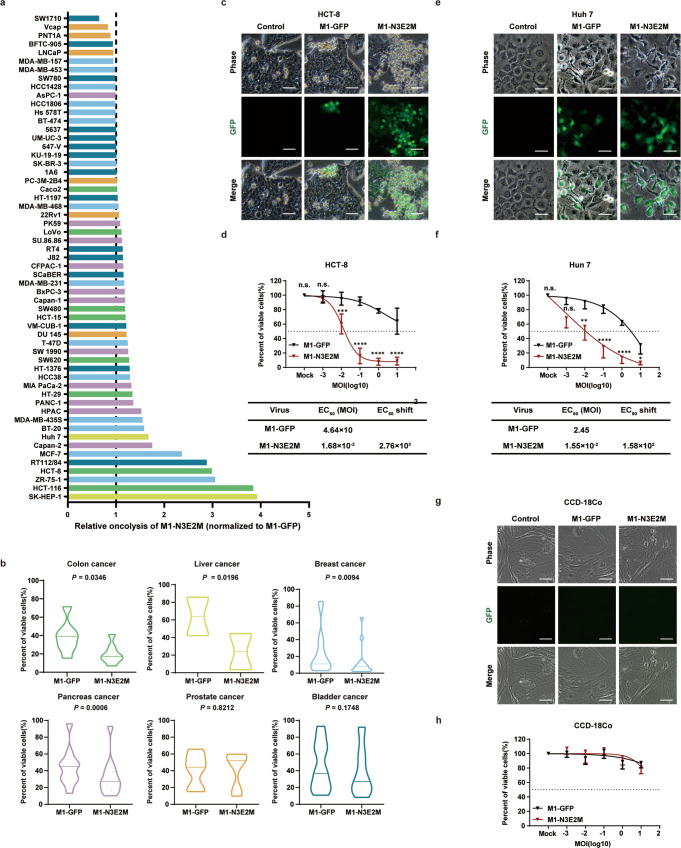
Fig. 2. The oncolytic effect of M1-N3E2M was improved in a variety of tumor cells, and it did not cause a CPE in normal cell line.
a The viability of 57 human cell lines were evaluated by an MTT assay 72 h after infection. Liver cancer is shown in yellow, colon cancer in green, prostate cancer in orange, pancreas cancer in purple, bladder cancer in blue and breast cancer in light blue. b The oncolytic effects of M1-GFP and M1-N3E2M were analyzed by Two-tailed paired t test and P values are indicated. The data are shown as violin plots with the box limits at minima and maxima and center line at median. (colon cancer, n = 8; liver cancer, n = 2; breast cancer, n = 15; pancreas cancer, n = 11; prostate cancer, n = 6; bladder cancer, n = 15). c, e HCT-8 and Huh-7 cells were infected with M1 viruses at an MOI of 0.1. Representative images of n = 3. Scale bars, 50 μm. d, f The viability of HCT-8 and Huh-7 cells was evaluated by an MTT assay. EC50 shift was calculated by nonlinear regression. Statistical significance was calculated using Two-way ANOVA with Sidak’s multiple comparisons test relative to M1-GFP. Adjusted P values are: d MOI (Mock), P > 0.9999; MOI (−3), P = 0.9991; MOI (−2), P = 0.0008; MOI (−1 to 1), P < 0.0001; f MOI (Mock), P > 0.9999; MOI (−3), P = 0.0528; MOI (−2), P = 0.0028; MOI (−1 and 0), P < 0.0001; MOI (1), P = 0.0489. g CCD-18Co cells were infected with M1-GFP and M1-N3E2M at an MOI of 10. Representative images of n = 3. Scale bars, 50 μm. h The viability of CCD-18Co cells was evaluated by an MTT assay. EC50 shift was calculated by nonlinear regression. n.s.: no significance, *P < 0.05, **P < 0.01, ***P < 0.001, ****P < 0.0001. Data points represent mean % viability relative to vehicle ± SD, for n = 3 biological replicates. Source data are provided as a Source Data file.

