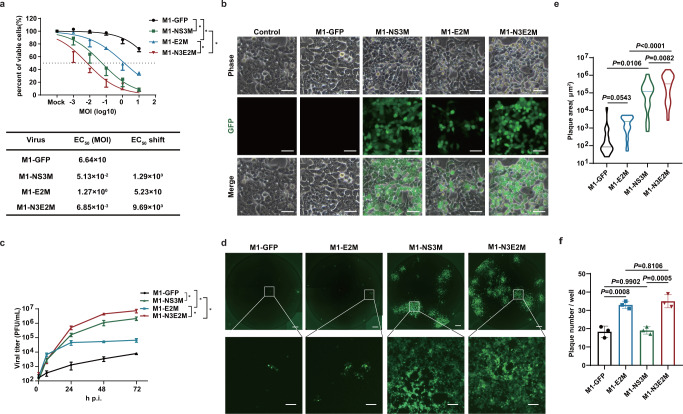
Fig. 4. The oncolytic effect of M1-N3E2M was synergistically enhanced by the M358L and K4N mutations.
a Cell viability was evaluated by an MTT assay. EC50 shift was calculated by nonlinear regression and the EC50 values were used for statistical analysis by unpaired t-test with Welch’s correction, M1-NS3M vs. M1-GFP, P = 0.0467; M1-E2M vs. M1-GFP, P = 0.0481; M1-N3E2M vs. M1-NS3M, P = 0.0345; M1-N3E2M vs. M1-E2M, P = 0.0237. Data points represent mean % viability relative to vehicle ± SD, for n = 3 biological replicates. b HCT-116 cells were infected with M1 viruses at an MOI of 0.1 and imaged 48 h after infection. Representative images of n = 3. Scale bars, 50 μm. c The viral titer was determined by a TCID50 assay. We performed a statistical analysis of the final virus production using unpaired t-test with Welch’s correction, M1-NS3M vs. M1-GFP, P = 0.0240; M1-E2M vs. M1-GFP, P = 0.0327; M1-N3E2M vs. M1-NS3M, P = 0.0451; M1-N3E2M vs. M1-E2M, P = 0.0284. Data points represent mean viral titer ± SD, for n = 3 biological replicates. d Monolayer HCT-116 cells were infected with M1 viruses at an MOI of 0.1. The medium was replaced with semisolid medium 1 h after infection. Representative images of n = 3. Scale bars, 500 μm. The scale bars in the magnified images represent 100 μm. e Quantification of the plaque area in (d). Statistical significance was calculated using unpaired t-test with Welch’s correction and P values are indicated. The data are shown as violin plots with the box limits at minima and maxima and center line at median (M1-GFP n = 21, M1-E2M n = 30, M1-NS3M n = 17, M1-N3E2M n = 32). f The plaques in (d) were counted. Statistical significance was calculated using One-way ANOVA with Tukey’s multiple comparisons test and P values are indicated. Graph bars represent mean plaque number per well ± SD, for n = 3 biological replicates. n.s.: no significance, *P < 0.05, **P < 0.01, ***P < 0.001, ****P < 0.0001. Source data are provided as a Source Data file.

