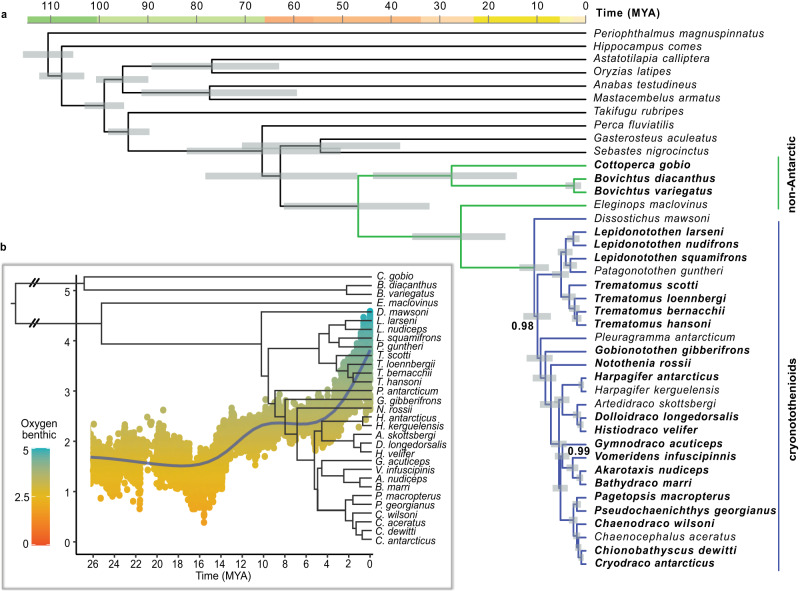
Fig. 2. New time-calibrated phylogeny and paleoclimate analysis.
a Time-calibrated phylogeny of 41 percomorph fish species, including 31 species of notothenioids and 10 outgroup fish species, generated with BEAST239. Branch length corresponds to time in million years (MYA) and grey rectangles show 95% highest posterior density intervals for node age estimates. All nodes received full support (Bayesian posterior probability = 1) except where noted. Species in bold were sequenced in this study. Branches for the Antarctic clade are highlighted in blue (cryonotothenioids), and non-Antarctic notothenioid species are marked in green. b Diversification of notothenioid species and temperature variation through time. Tree based on notothenioid species from panel a. The scatterplot shows data based on deep-sea δ18O benthic records which inversely reflect temperature with higher δ18O benthic corresponding to lower temperatures (green) and lower δ18O corresponding to higher temperatures (orange). The oxygen benthic is expressed as a ratio of two concentrations of oxygen isotopes36; blue line shows moving average (Generalised Additive Model). Source data can be found in the Dryad repository at 10.5061/dryad.80gb5mktn.

