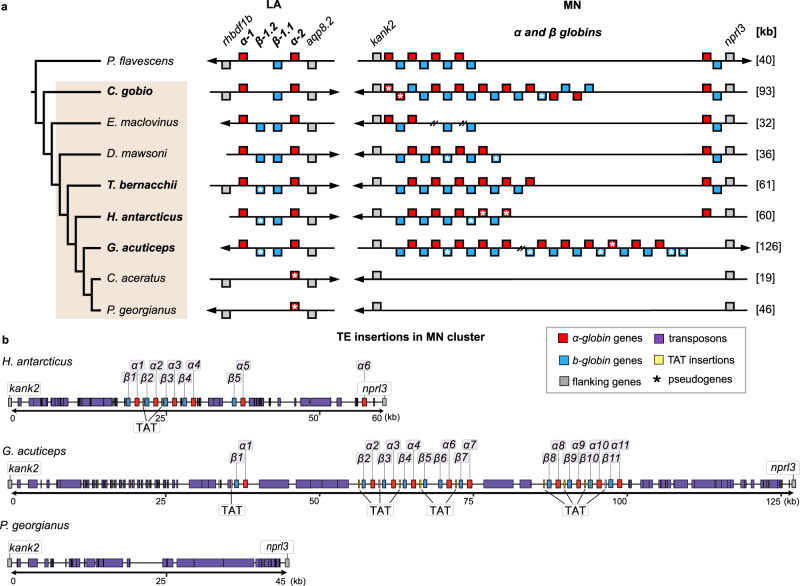
Fig. 5. Reconstructed synteny of haemoglobin loci and TE insertions.
a Species analysed and syntenic reconstruction of LA and MN haemoglobin gene clusters. b Transposon insertions in the MN region of H. antarcticus, G. acuticeps, and P. georgianus genomes. Red: α-globin genes, blue: β-globin genes, grey: flanking genes, purple: transposon insertions, yellow: TAT-like repeats. Pseudogenes are marked with asterisks. Breaks in the assembly are indicated with double forward slashes. Bold face indicates species sequenced in the present study. Arrows show locus orientation and total lengths of MN locus in different species are given in brackets (kb, at right). Source data are provided as a Source Data file.

