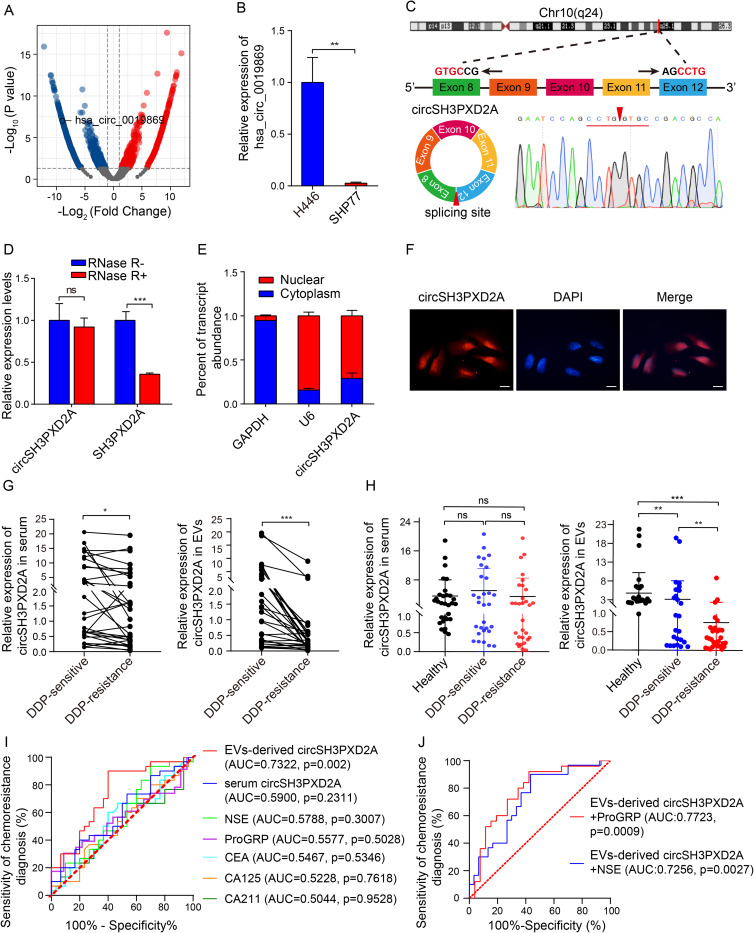
Figure 1.
CircSH3PXD2A was downregulated in chemoresistant SCLC cells and negatively correlated with chemoresistance. (A) Volcano plot for differentially expressed circRNAs between chemosensitive H446 and chemoresistant SHP77 cells. (B) qRT-PCR analysis of hsa_circ_0019869 levels in H446 and SHP77 cells. (C) Schematic diagram of circSH3PXD2A and its back-splicing site. The red arrow indicates the back-splicing site. (D) The expression levels of circSH3PXD2A and its host gene SH3PXD2A were determined by qRT‒PCR after treatment with RNase R or without RNase R. (E and F) Nuclear‑cytoplasmic fraction assay (E) and FISH assay (F) were employed to confirm the distribution of circSH3PXD2A. Scale bar, 10 μm (G) The circSH3PXD2A levels in serum (left) and EVs (right) in SCLC patients before and after cisplatin resistance (n=30). (H) qRT-qPCR analysis of the serum (left) and EVs-derived (right) circSH3PXD2A expression levels of DDP-resistant patients (n=30), DDP-sensitive patients (n=30) and normal controls (n=30). (I) Comparison of the diagnostic efficiency of EVs-derived and serum circSH3PXD2A and serum tumor markers in patients with SCLC before and after DDP resistance. (J) The diagnostic efficiency of serum tumor markers combined with EVs-derived circSH3PXD2A in patients with SCLC before and after DDP resistance. *p < 0.05 **p < 0.01, ***p<0.001.
Abbreviations: ns, no significance; DDP, cis-platinum.

