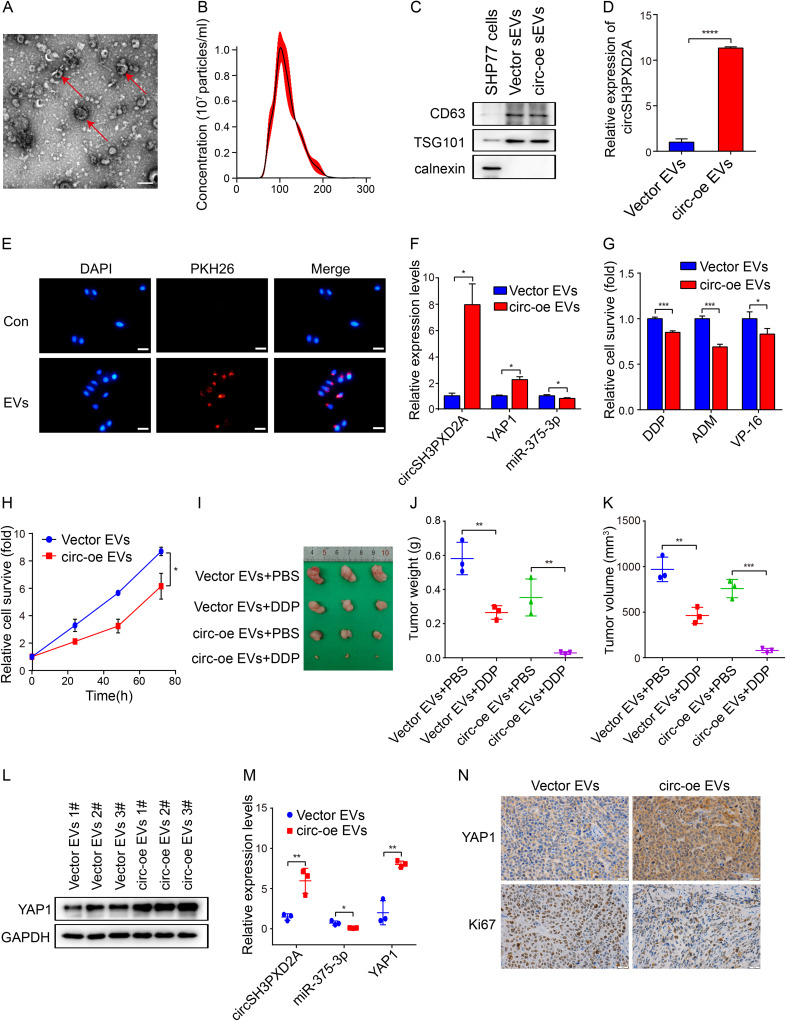
Figure 7.
Effect of EVs-delivered circSH3PXD2A on the chemoresistance of SCLC in vitro and in vivo. (A) Transmission electron microscopy showed the morphology of EVs. Scale bar, 200 nm. (B) Nanoparticle tracking analysis determined EVs size. (C) Western blotting showing the EVs protein markers CD63 and TSG101 were enriched in EVs secreted by SCLC cells. Calnexin was used as a negative control. (D) The expression level of circSH3PXD2A in vector EVs and circ-oe EVs.(E) EVs uptake assay revealed that PKH26-labeled EVs were absorbed by SCLC cells. Scale bar, 100 μm. (F) Determination of the mRNA expression levels of circSH3PXD2A, miR-375-3p and YAP1 in H446 cells after coculture with vector EVs or circ-oe EVs. (G and H) Chemoresistance (G) and cell proliferation ability (H) were analyzed in H446 cells treated with vector EVs or circ-oe EVs. (I) Representative images of tumors from balb/c mice. (J and K) Comparison of tumor weight (J) and tumor weight (K) of sacrificed mice. (L and M) Analysis of the protein levels of YAP1 (L) and the mRNA levels of circSH3PXD2A, miR-375-3p and YAP1 (M). (N) IHC detection of YAP1 and Ki67 protein levels in tumors from balb/c mice. Scale bar, 20 μm. *p<0.05, **p<0.01, ***p<0.001, ****p<0.0001.

