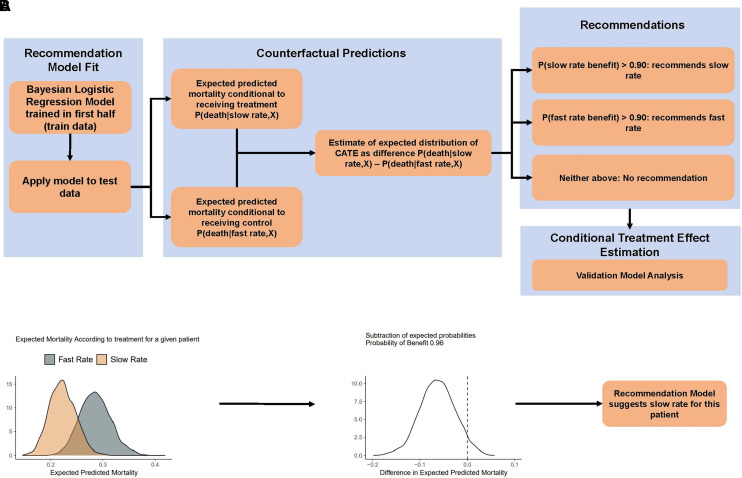
Figure 1.
Methods flowchart. (A) Flowchart of the steps provided in the text. (B) Estimation of distribution of expected distribution of conditional treatment effect (CATEed) using one patient as an example. The first panel shows the expected posterior distribution according to infusion rate given the recommendation model. The middle panel shows the density plot for the difference of the expected predicted mortalities (i.e., CATEed). For this patient, because there is more than 0.90 probability that mortality rate is lower with the slow rate, the recommendation model will recommend the slow rate. CATE = conditional average treatment effect.

