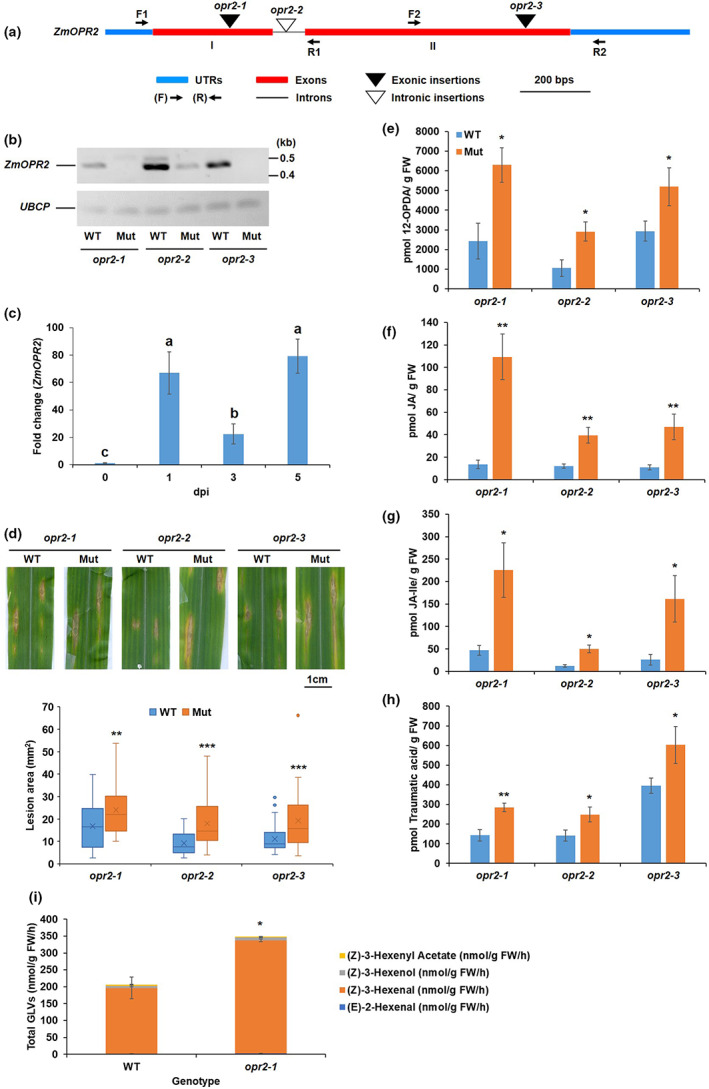
FIGURE 1.

Disruption of ZmOPR2 reduced resistance to Colletotrichum graminicola. (a) Schematic representation of the genomic structure of ZmOPR2 showing the Mutator (Mu)‐element insertion sites. (b) Reverse transcription‐PCR analysis of ZmOPR2 gene expression in opr2‐1, opr2‐2, and opr2‐3 mutants and their corresponding wild type (WT). ZmOPR2 gene expression in opr2‐1 and opr2‐2 was checked using primer pair F1 and R1 while primer pair F2 and R2 was used in opr2‐3. UBCP (Ubiquitin carrier protein) represents a reference gene. (c) Expression of ZmOPR2 at 1, 3, and 5 days postinoculation (dpi) in response to C. graminicola infection relative to uninfected control at day 0. Bars are mean ± SEM (n = 5 maize plants of each genotype as biological replicates, no technical replicate). Different letters indicate statistically significant differences among the samples (Tukey's HSD test, p < 0.05). (d) Disease symptoms of opr2‐1, opr2‐2, and opr2‐3 mutants and their WT 7 dpi with C. graminicola. Disease symptoms were scanned and lesion areas were measured using ImageJ software. The data are shown in the box and whisker plot and × indicates means (n = 36 lesions from six different plants of each genotype as biological replicates). Outliers are represented by dots. The experiments were repeated at least two times with similar results. Contents of (e) 12‐OPDA, (f) jasmonic acid (JA), (g) JA‐Ile, and (h) traumatic acid were measured at 7 dpi. Bars are mean ± SEM (n = 6 maize plants of each genotype as biological replicates). (i) Quantification of total green leaf volatiles (GLVs) emissions in opr2‐1 mutant and its WT leaves 7 dpi with C. graminicola. Measurement of selected volatile emissions (z)‐3‐henxenyl acetate, (Z)‐3‐hexenol, (z)‐3‐hexenal, and (E)‐2‐hexenal. Bars are sum of mean ± SEM of each volatile (n = 4 maize plants of each genotype as biological replicates). Asterisks represent statistically significant differences between WT and mutant (Student's t test, *p < 0.05, **p < 0.01, ***p < 0.001).
