
FIGURE 3.
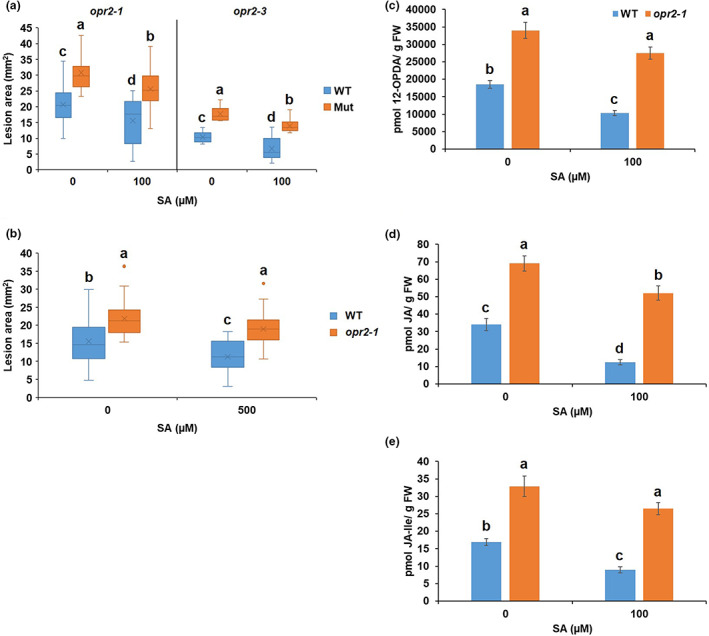
Salicylic acid (SA) treatment failed to fully restore the resistance of opr2 mutants to wild‐type (WT) level against Colletotrichum graminicola. (a) opr2‐1 and opr2‐3 mutants and their WT were sprayed with 2 ml of mock or 100 μM SA 1 h prior to inoculation with C. graminicola. (b) opr2‐1 and WT were sprayed with mock or 500 μM SA 24 h prior to inoculation with C. graminicola. Disease symptoms were scanned and lesion areas were measured using ImageJ software at 7 days postinoculation (dpi). The data are shown in the box and whisker plot and X indicates means (n = 36 lesions from six different plants of each genotype as biological replicates). Outliers are represented by dots. Different letters indicate statistically significant differences within the same allele on log‐transformed data (Tukey's HSD test, p < 0.05). These experiments were repeated at least two times with similar results. Contents of (c) 12‐OPDA, (d) JA, and (e) JA‐Ile were measured of the mock or 100 μM SA‐treated WT, opr2‐1, lox10‐3, and lox10opr2 mutants 5 dpi with C. graminicola. Bars are mean ± SEM (n = 5 maize plants of each genotype as biological replicates). Different letters indicate statistically significant differences (Tukey's HSD, p < 0.05).